Fig. 11.
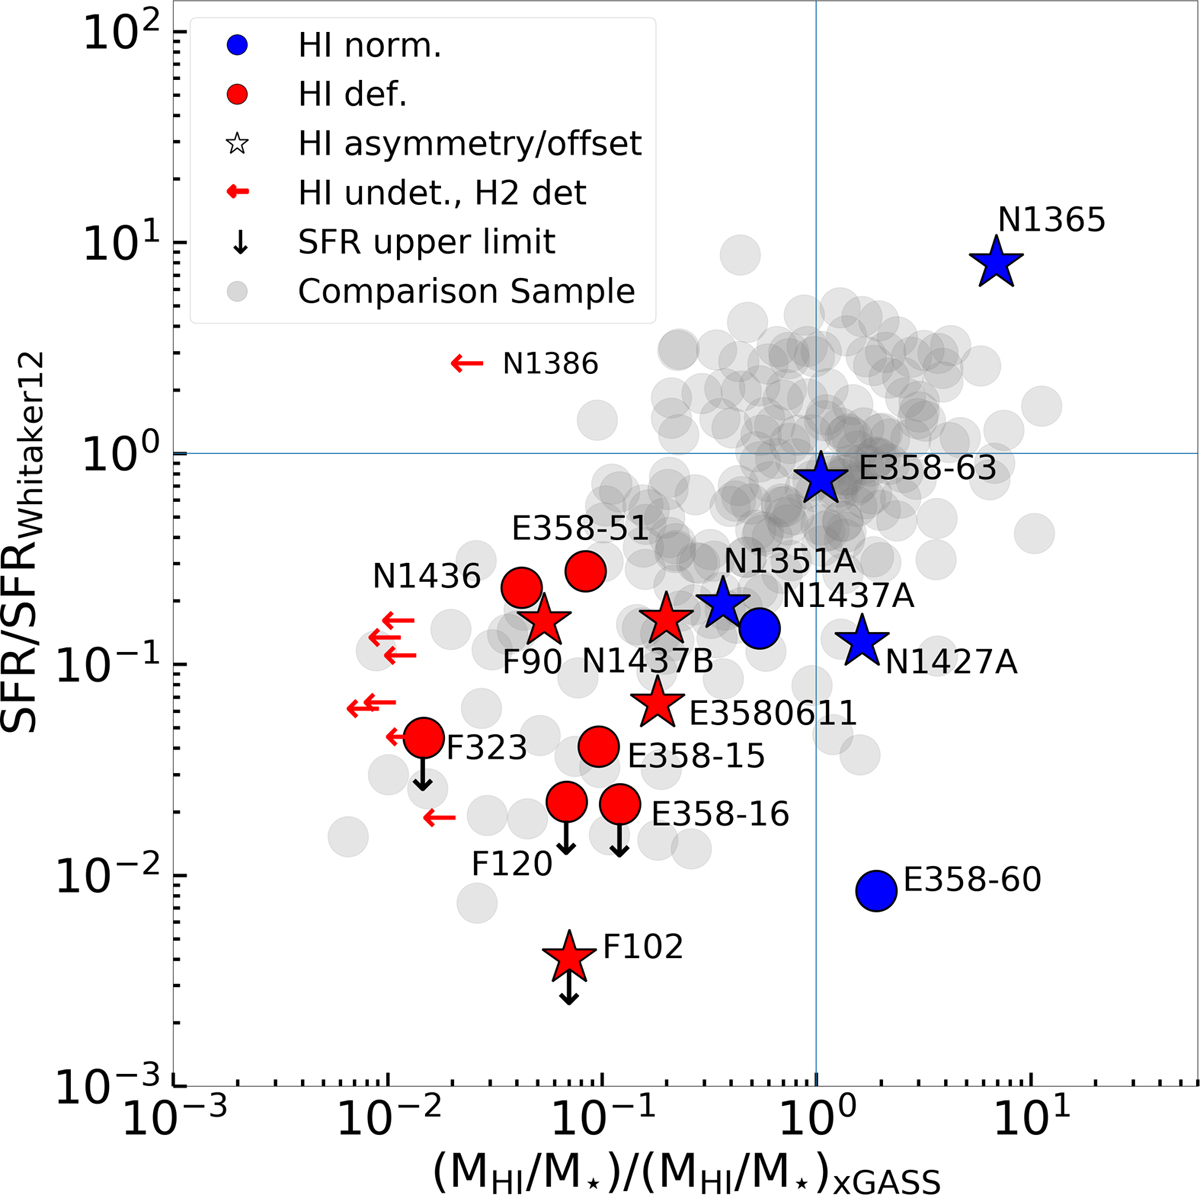
SFR deviation from the Whitaker et al. (2012) scaling relation (Fig. 10) plotted against the MHI/M⋆ deviation from the xGASS scaling relation (Fig. 6). We use the same colour coding as Fig. 6. We show upper limits in MHI with leftward arrows. The horizontal blue line represents no deviation from the SFR scaling relation, while the vertical blue line represents no deviation from the M⋆−MHI/M⋆ scaling relation.
Current usage metrics show cumulative count of Article Views (full-text article views including HTML views, PDF and ePub downloads, according to the available data) and Abstracts Views on Vision4Press platform.
Data correspond to usage on the plateform after 2015. The current usage metrics is available 48-96 hours after online publication and is updated daily on week days.
Initial download of the metrics may take a while.