Fig. 1.
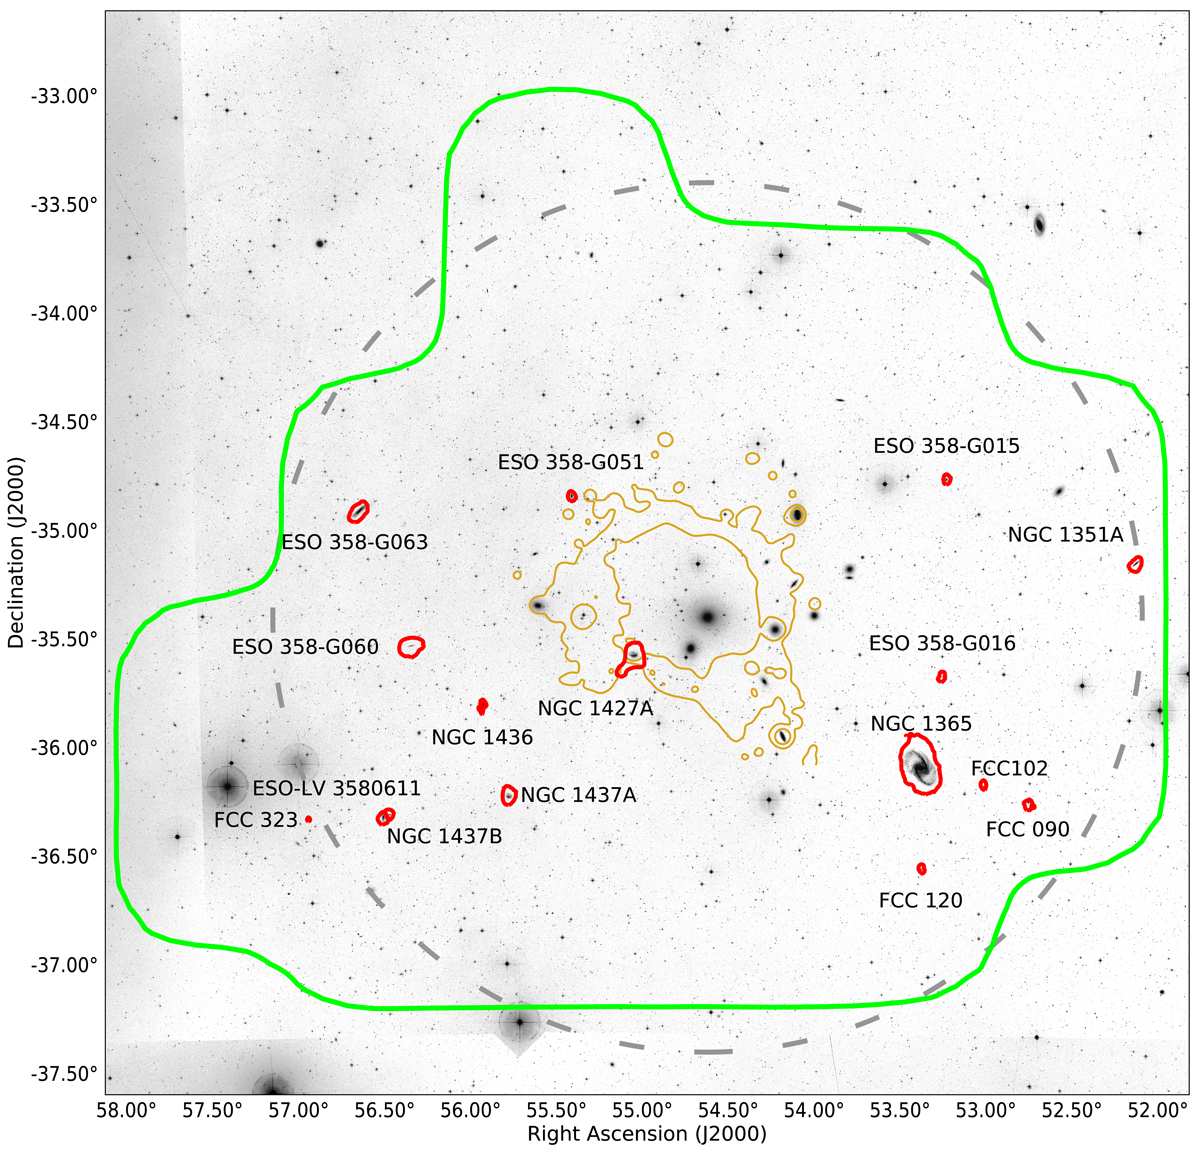
Layout and detections of our ATCA HI survey. The green outline includes the 15-deg2 region where the average noise is 2.8 mJy beam−1 (see Sect. 2). The red contours represent the lowest reliable HI column density – 3σ over 25 km s−1 – of our 16 detections. The grey dashed circle is Rvir. The background optical image comes from the Digital Sky Survey (blue band). The yellow contours show the X-ray emission in the Fornax cluster detected with XMM-Newton (Frank et al. 2013) and convolved with a 3 arcmin FWHM gaussian kernel. These contours are spaced by a factor of 2, with the lowest level at 3.7 counts deg−2 s−1.
Current usage metrics show cumulative count of Article Views (full-text article views including HTML views, PDF and ePub downloads, according to the available data) and Abstracts Views on Vision4Press platform.
Data correspond to usage on the plateform after 2015. The current usage metrics is available 48-96 hours after online publication and is updated daily on week days.
Initial download of the metrics may take a while.