Fig. 4
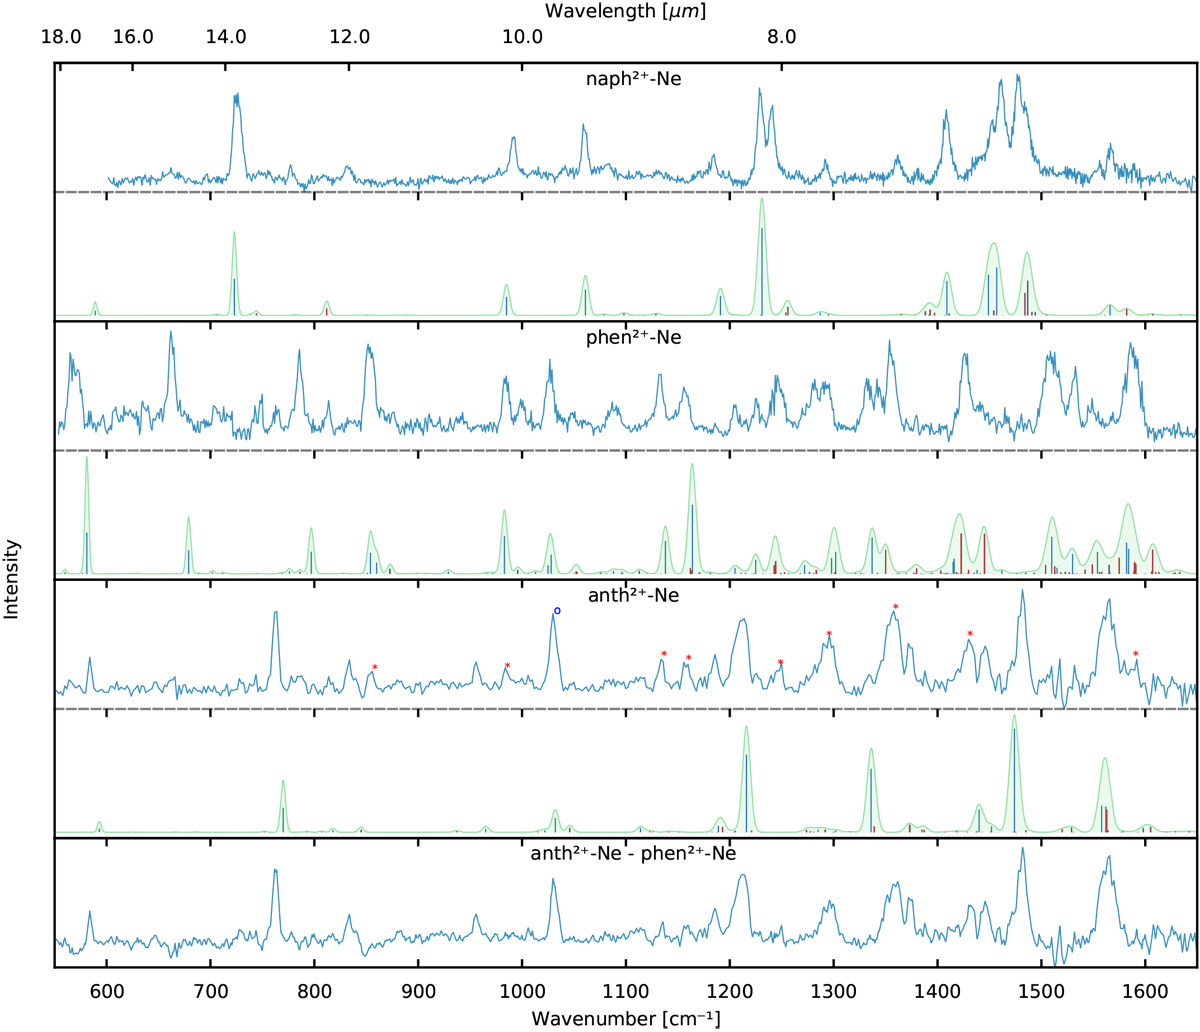
IRPD spectrum of Ne-tagged dications naph2+, phen2+, and anth2+ compared to calculated anharmonic (B3LYP/6-311+G(d,p)) spectra, respectively. The calculated spectrum was convoluted with a Gaussian lineshape function, where the width is givenby the FEL bandwidth, and the area corresponds to the calculated intensity in km mol−1. The spectrum in the bottom panel is the anth2+-Ne spectrum subtracted by 30% of the weight of the relative intensity of the phen2+ -Ne spectrum to account for the contaminated bands.
Current usage metrics show cumulative count of Article Views (full-text article views including HTML views, PDF and ePub downloads, according to the available data) and Abstracts Views on Vision4Press platform.
Data correspond to usage on the plateform after 2015. The current usage metrics is available 48-96 hours after online publication and is updated daily on week days.
Initial download of the metrics may take a while.