Fig. 5.
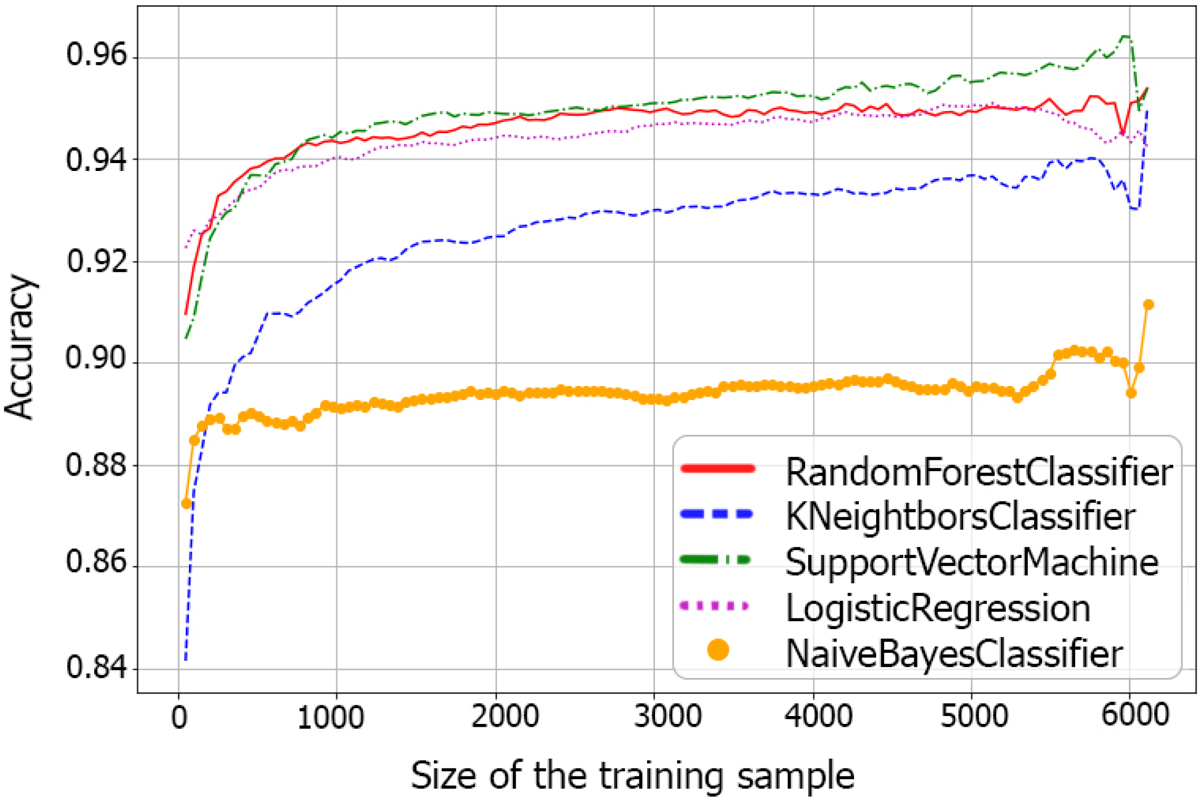
Verification of whether there are enough galaxies in a training sample to build a machine learning model. The green line (support-vector machine), the red line (random forest), the pink line (logistic regression), the blue line (k-nearest neighbors), and the orange line (naive Bayes) show the average accuracy of ten repetitions of the evaluation procedure in Scikit-learn machine learning with Python.
Current usage metrics show cumulative count of Article Views (full-text article views including HTML views, PDF and ePub downloads, according to the available data) and Abstracts Views on Vision4Press platform.
Data correspond to usage on the plateform after 2015. The current usage metrics is available 48-96 hours after online publication and is updated daily on week days.
Initial download of the metrics may take a while.