Free Access
Fig. 4.
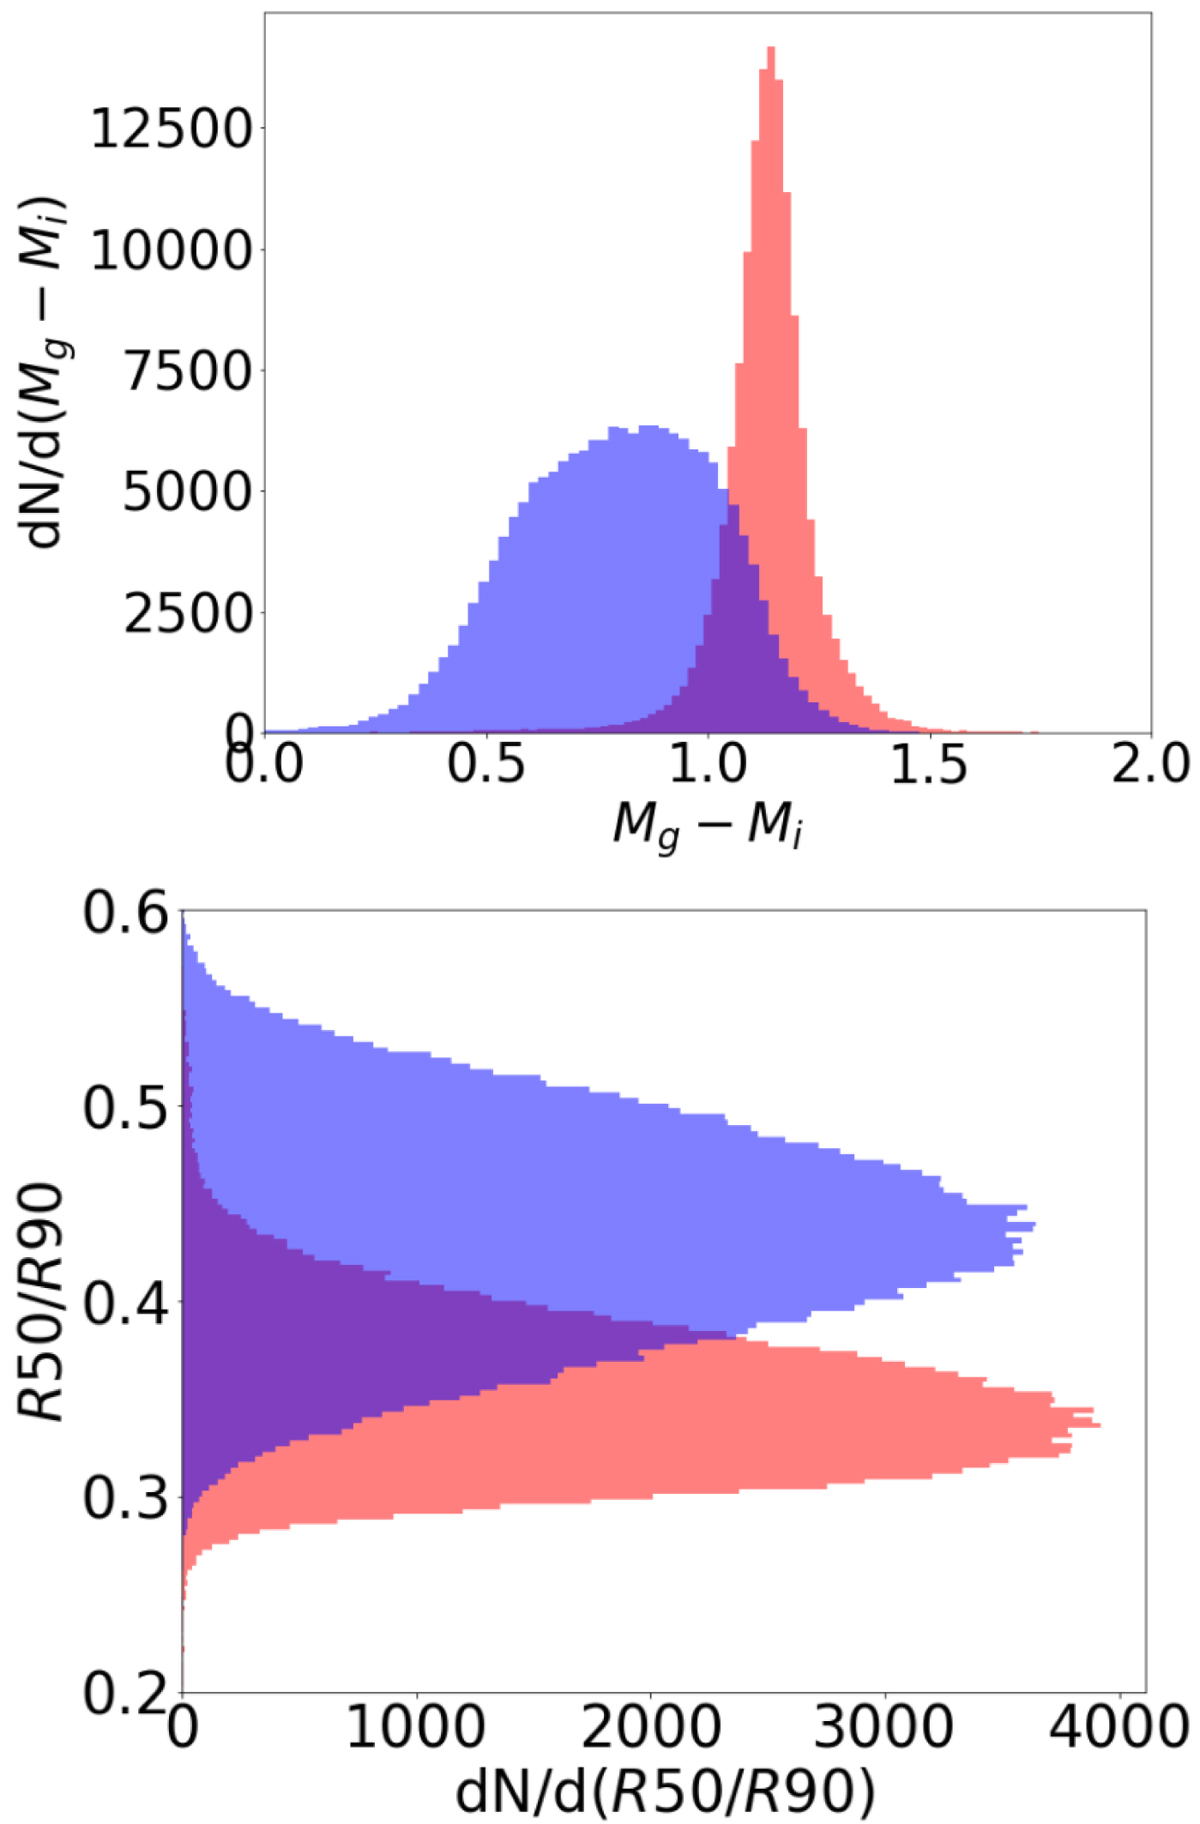
Distribution of the morphological types (early in red, late in blue) in dependence on the color indices Mg − Mi (top) and inverse concentration index R50/R90 (bottom) for the main sample of 316 031 galaxies as in Fig. 3.
Current usage metrics show cumulative count of Article Views (full-text article views including HTML views, PDF and ePub downloads, according to the available data) and Abstracts Views on Vision4Press platform.
Data correspond to usage on the plateform after 2015. The current usage metrics is available 48-96 hours after online publication and is updated daily on week days.
Initial download of the metrics may take a while.