Free Access
Fig. 9
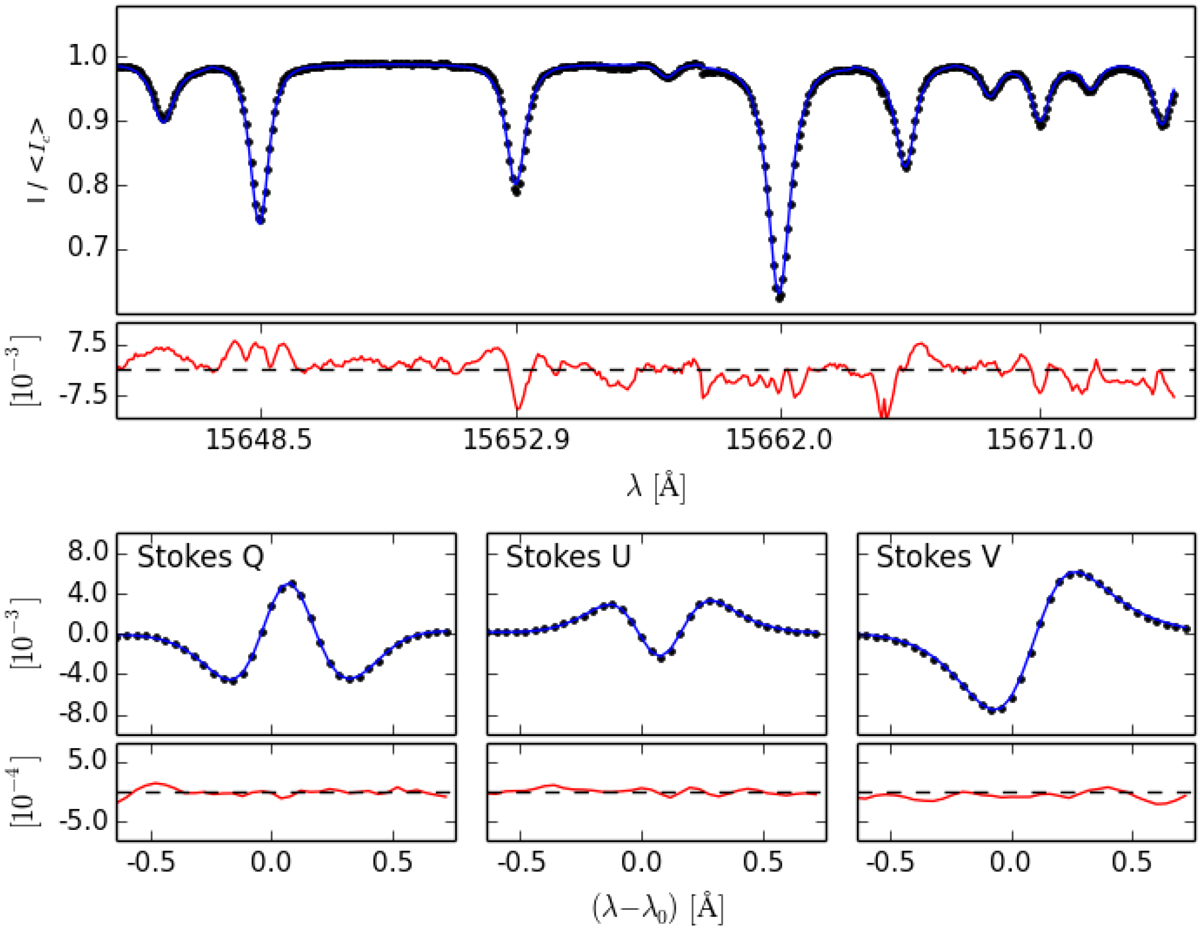
Fits achieved in the last inversion step between the observation (black points) and the synthesis (blue solid lines) in a single pixel. Upper panel: intensity profiles. Lower panel: stokes Q, U, and V of the 15 648.514 Å spectral line. The residuals are shown with a red solid line.
Current usage metrics show cumulative count of Article Views (full-text article views including HTML views, PDF and ePub downloads, according to the available data) and Abstracts Views on Vision4Press platform.
Data correspond to usage on the plateform after 2015. The current usage metrics is available 48-96 hours after online publication and is updated daily on week days.
Initial download of the metrics may take a while.