Fig. 8
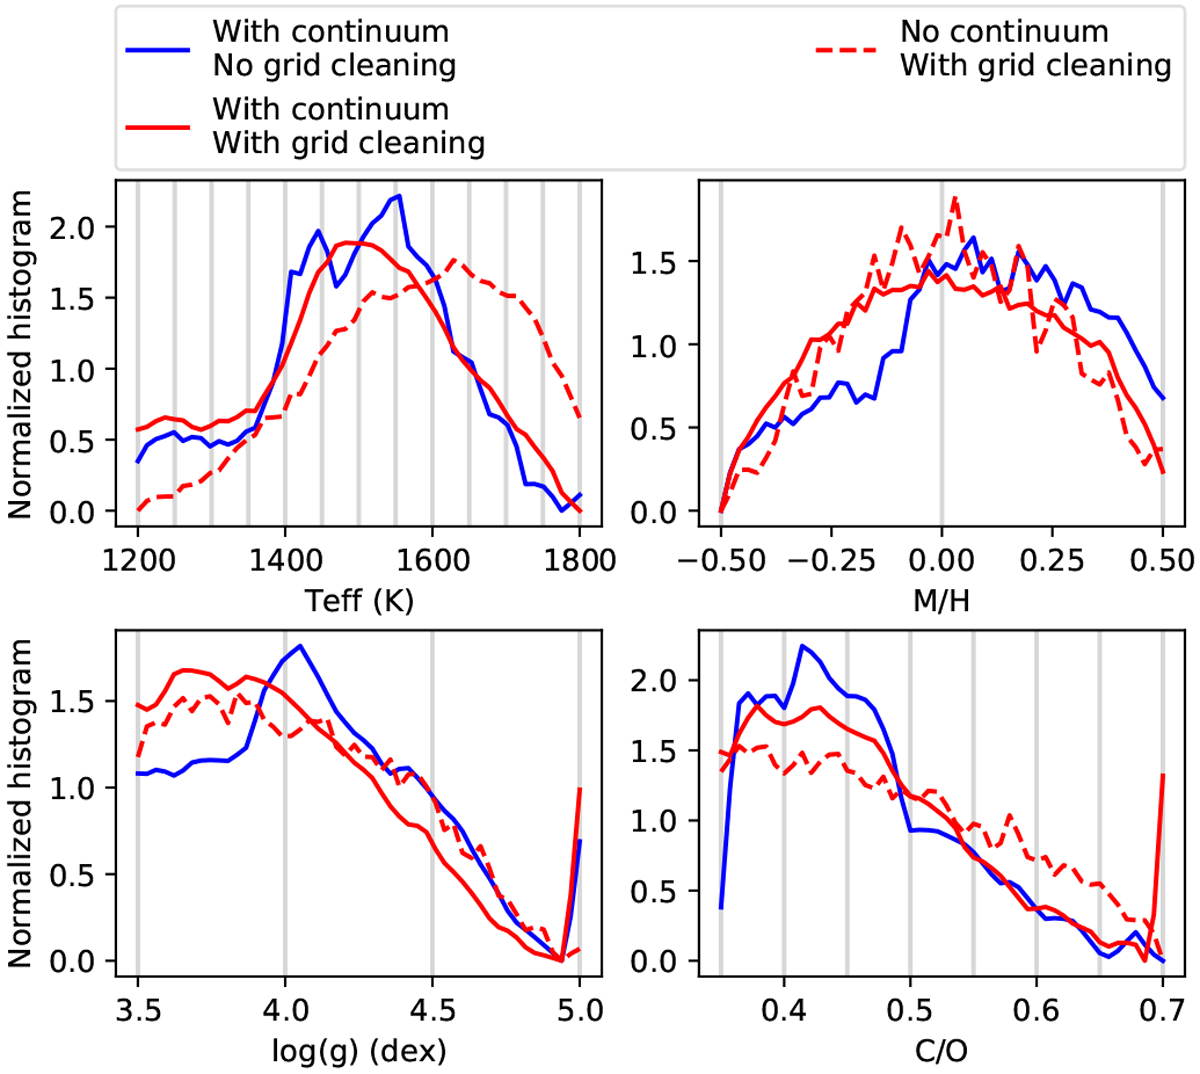
Comparison of posteriors from ForMoSA with different data and model configurations with the grid Exo-REM. We show in blue that the grid has been taken on the shelf and the continuum has been kept. In red (solid line) we show that the grid has been cleaned of its nonconverged models and the continuum has been kept. In red (dashed line) we plot the grid that has been cleaned of its nonconverged models and the continuum has been removed. We show in grey the grid steps for each parameter.
Current usage metrics show cumulative count of Article Views (full-text article views including HTML views, PDF and ePub downloads, according to the available data) and Abstracts Views on Vision4Press platform.
Data correspond to usage on the plateform after 2015. The current usage metrics is available 48-96 hours after online publication and is updated daily on week days.
Initial download of the metrics may take a while.