Fig. 17
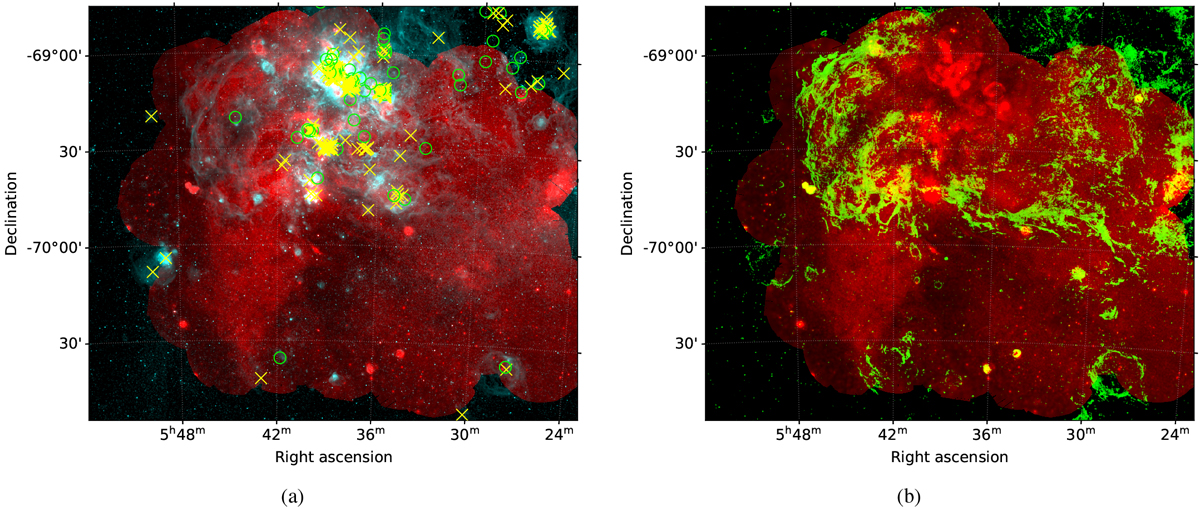
(a) Soft X-ray emission mosaic in the 0.4–1.25 keV range (red) and MCELS Hα (cyan). Massive stars in the vicinity are marked with yellow crosses (O stars) and green circles (WR stars) (Bonanos et al. 2009). (b) Soft X-ray emission mosaic in the 0.4–1.25 keV range (red) and MCELS [S II]/Hα ratio ratio in green. Only ratio values above the threshold of 0.4 are shown. The vicinity of 30 Dor appears blank since we have very strong Hα emission here, thus yielding a very low ratio.
Current usage metrics show cumulative count of Article Views (full-text article views including HTML views, PDF and ePub downloads, according to the available data) and Abstracts Views on Vision4Press platform.
Data correspond to usage on the plateform after 2015. The current usage metrics is available 48-96 hours after online publication and is updated daily on week days.
Initial download of the metrics may take a while.