Fig. 10
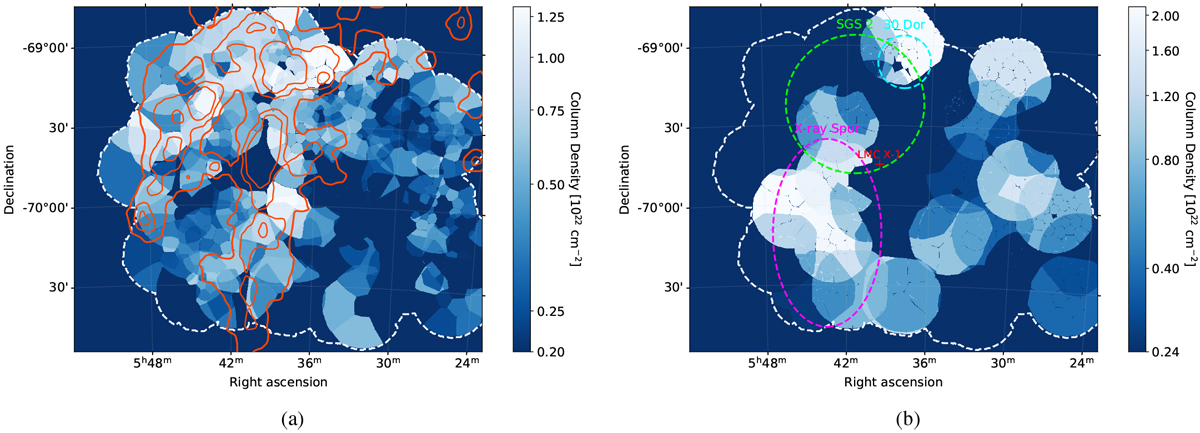
(a) Map of the lower limit (90% CI) foreground X-ray absorbing hydrogen column density equivalent NH in units of 1022 cm−2. The tessellate spectra were fit with the two-APEC model. The contours of the dust optical depth are overlayed in orange, where the contours levels correspond to the 80– 95 percentile range (2.0 × 10⁻⁵ − 6.4 × 10⁻⁵) of the image shown in Fig. 16a. (b) Map of the lower limit (90% CI) background X-ray absorbing hydrogen column density equivalent NH,BG in units of 1022 cm−2. The tessellate spectra were fit with the two-APEC model. The positions of the X-ray spur, LMC-SGS 2 and LMC X-1 are marked for orientation. We only obtain one NH,BG value per observation since the parameter was linked between the tessellates. The fit values were averaged for regions where observations overlap. The area covered by the spectral analysis is indicated with dashed white lines both in (a) and (b).
Current usage metrics show cumulative count of Article Views (full-text article views including HTML views, PDF and ePub downloads, according to the available data) and Abstracts Views on Vision4Press platform.
Data correspond to usage on the plateform after 2015. The current usage metrics is available 48-96 hours after online publication and is updated daily on week days.
Initial download of the metrics may take a while.