Fig. 14.
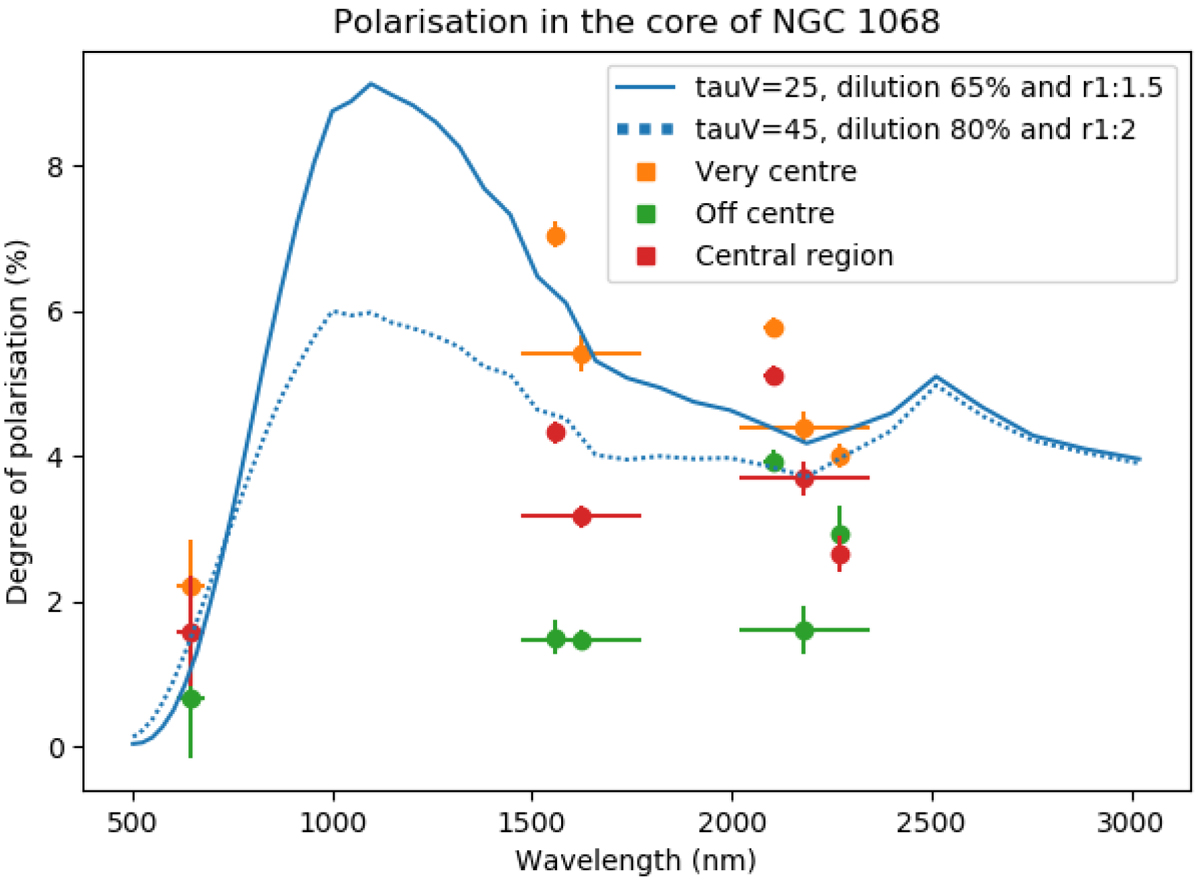
Degree of polarisation (in %) as a function of wavelength (in nm) for both simulations and observations. The measurements are the same as in the first panel of Fig. 9 and represent the very centre in orange, the off-centre region in green, and the whole central region in red. The simulated spectra are shown in a continuous blue line for a grain ratio of 1:1.5 and dashed line for a ratio of 1:2, with corresponding optical depth and dilution fraction parameters to best fit the very-centre (orange) data points.
Current usage metrics show cumulative count of Article Views (full-text article views including HTML views, PDF and ePub downloads, according to the available data) and Abstracts Views on Vision4Press platform.
Data correspond to usage on the plateform after 2015. The current usage metrics is available 48-96 hours after online publication and is updated daily on week days.
Initial download of the metrics may take a while.