Open Access
Fig. 12.
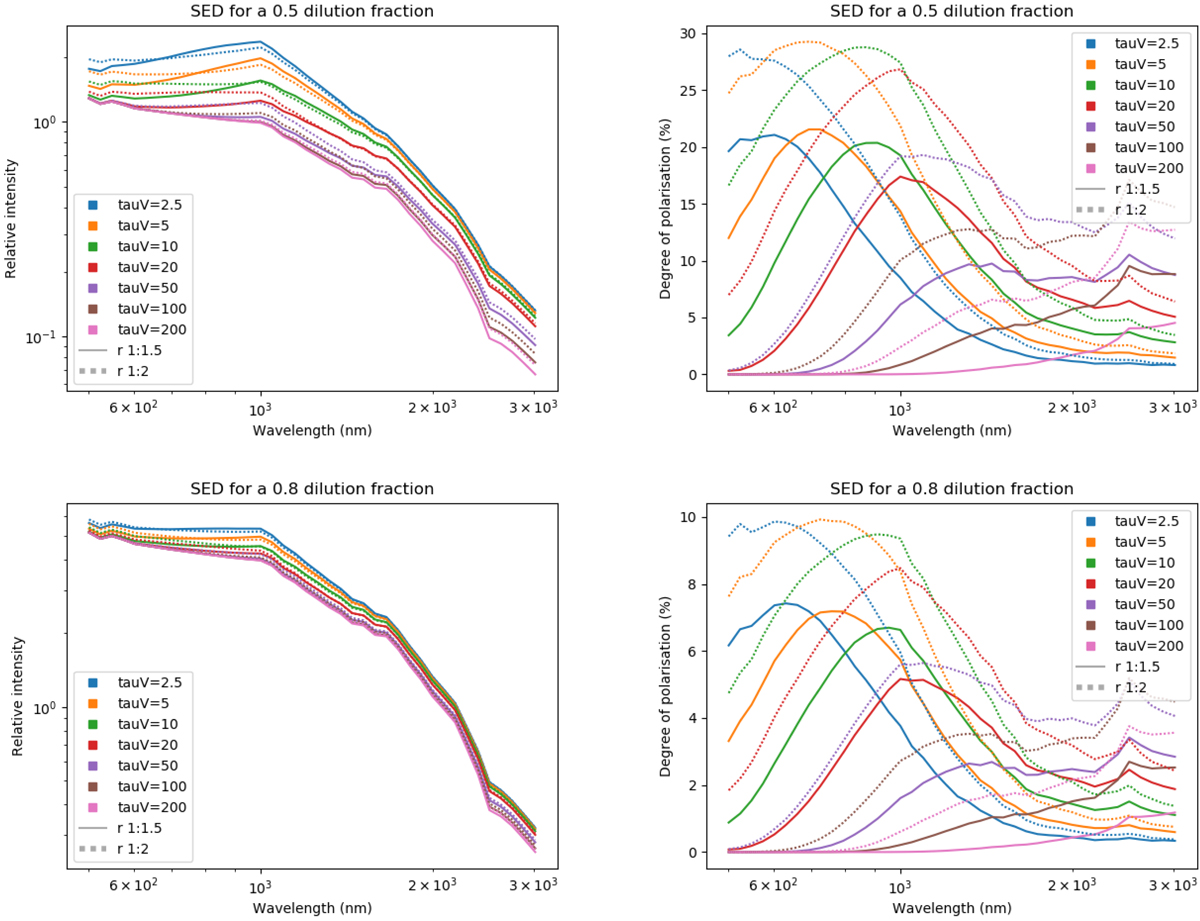
Spectra of relative intensity (first column) and degree of polarisation (second column) for an AGN with dilution fractions of 50% (first row) and 80% (second row) from MontAGN simulations. Intensity is normalised to the maximum of the dichroic flux as detailed in text.
Current usage metrics show cumulative count of Article Views (full-text article views including HTML views, PDF and ePub downloads, according to the available data) and Abstracts Views on Vision4Press platform.
Data correspond to usage on the plateform after 2015. The current usage metrics is available 48-96 hours after online publication and is updated daily on week days.
Initial download of the metrics may take a while.