Fig. F.1.
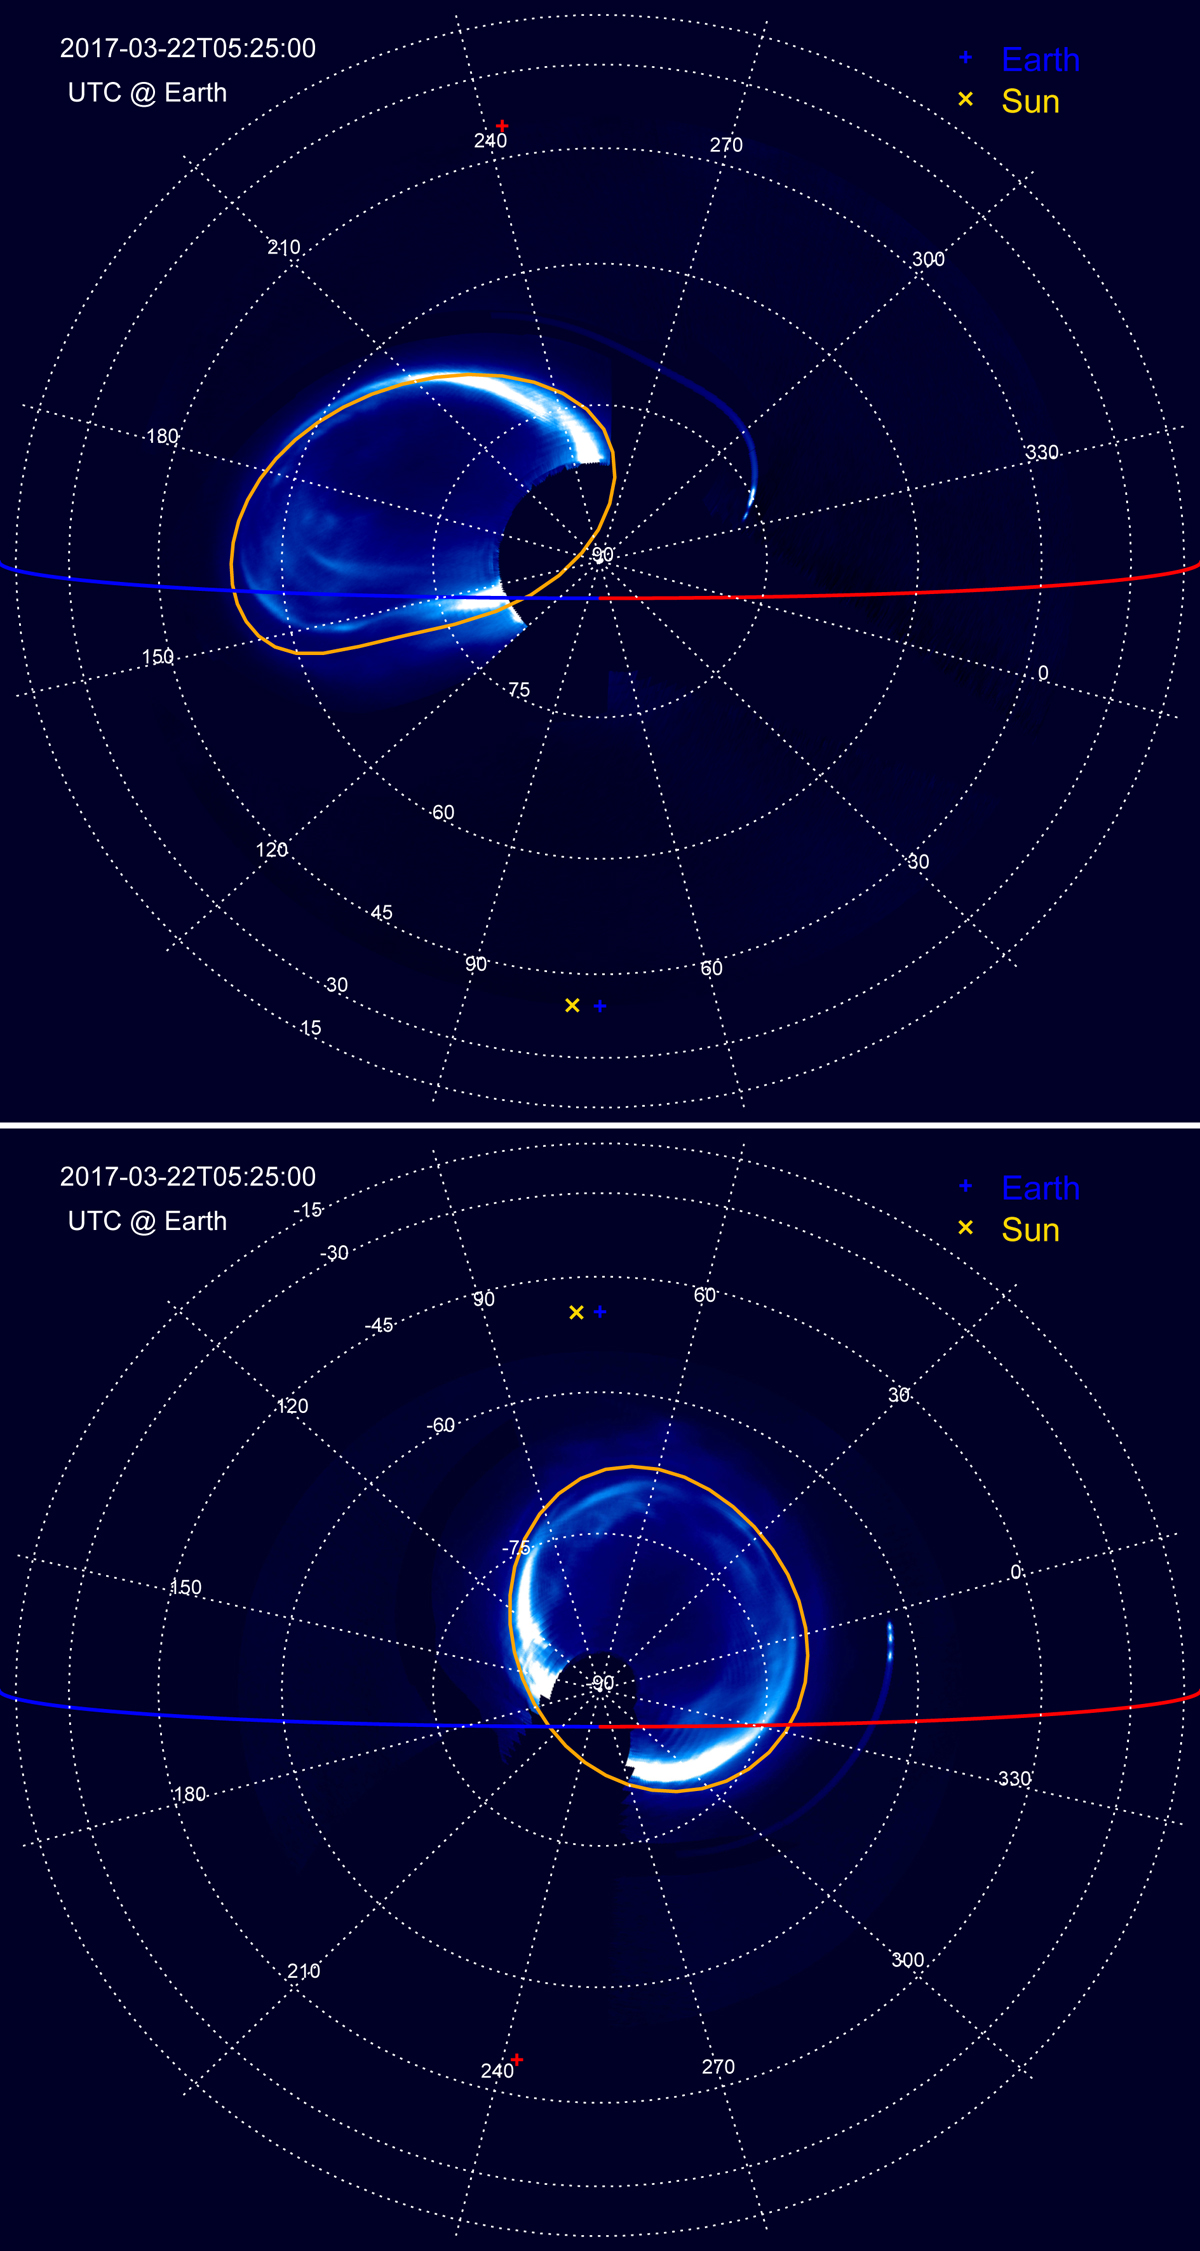
Ultraviolet aurora models at the time of the ALMA observations. Top: northern polar projection of the brightness of the statistical UV aurora in the configuration of the ALMA observations. The red and blue lines represent the east and west terminators. The orange lines show the M = 30 footprints of the magnetic field model from Connerney et al. (2018). The subsolar and sub-Earth points are indicated with yellow and blue crosses, respectively. The red cross indicates the CML of the Johnson et al. (2017) measurements of ionospheric winds. Bottom: southern polar projection of the brightness of the statistical UV aurora in the configuration of the ALMA observations.
Current usage metrics show cumulative count of Article Views (full-text article views including HTML views, PDF and ePub downloads, according to the available data) and Abstracts Views on Vision4Press platform.
Data correspond to usage on the plateform after 2015. The current usage metrics is available 48-96 hours after online publication and is updated daily on week days.
Initial download of the metrics may take a while.