Fig. E.1.
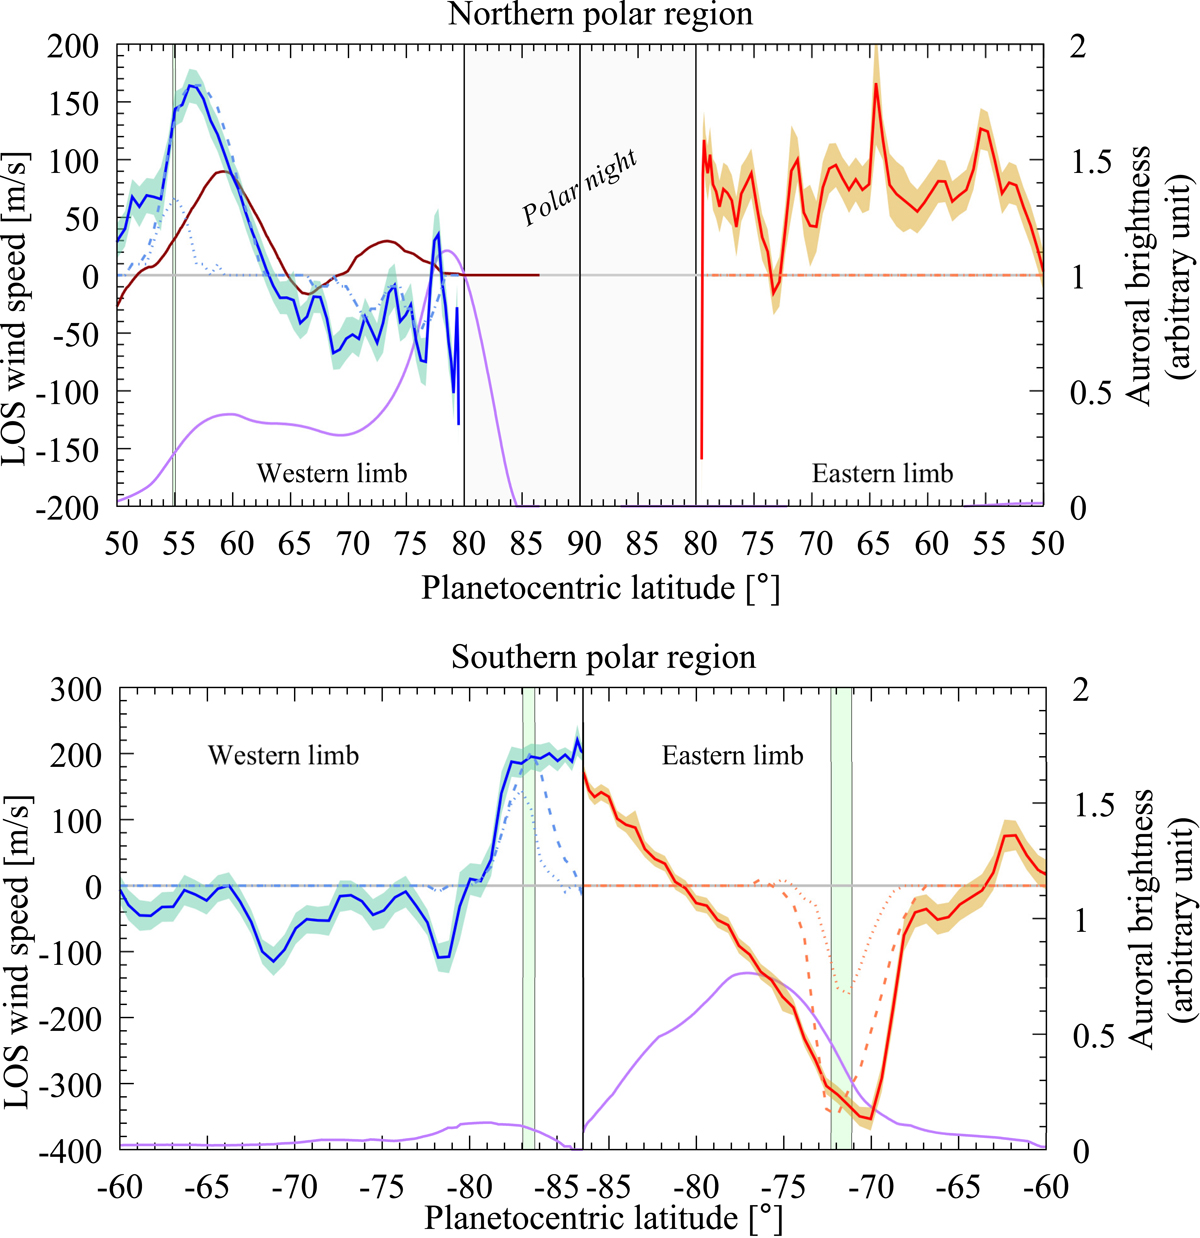
Comparison of models with observations: comparison between LOS velocities measured at 0.1 mbar with ALMA (same color code as in Fig. 2, top) and simulation results. A model with constant counterrotation winds within the ovals as defined by Bonfond et al. (2012) results in too narrow wind peaks, as shown with the dotted light blue and orange lines, regardless of the wind speed. The dashed light blue and orange lines are produced with constant counterrotation winds within the auroral ovals of 300 m s−1 (north) and 370 m s−1 (south) in the case of extended ovals, as described in the main text. The latitudes swept by the M = 30 footprints of the Connerney et al. (2018) magnetic field model are plotted with green stripes. The wind peaks are found within 1−2° of these footprints. The statistical UV brightness model (purple line) derived from the observations of Clarke et al. (2009) and the ionospheric winds (brown line; speeds divided by five on the plot for an easier comparison) derived from the ![]() infrared observations of Johnson et al. (2017) are also included for a qualitative comparison with our measured wind speeds. Both UV brightness and
infrared observations of Johnson et al. (2017) are also included for a qualitative comparison with our measured wind speeds. Both UV brightness and ![]() wind curves have been degraded to the ALMA spatial resolution. The data from Johnson et al. (2017) are taken from their Fig. 8f. The northern auroral region is in the top panel, and the southern auroral region is in the bottom panel.
wind curves have been degraded to the ALMA spatial resolution. The data from Johnson et al. (2017) are taken from their Fig. 8f. The northern auroral region is in the top panel, and the southern auroral region is in the bottom panel.
Current usage metrics show cumulative count of Article Views (full-text article views including HTML views, PDF and ePub downloads, according to the available data) and Abstracts Views on Vision4Press platform.
Data correspond to usage on the plateform after 2015. The current usage metrics is available 48-96 hours after online publication and is updated daily on week days.
Initial download of the metrics may take a while.