Fig. B.1.
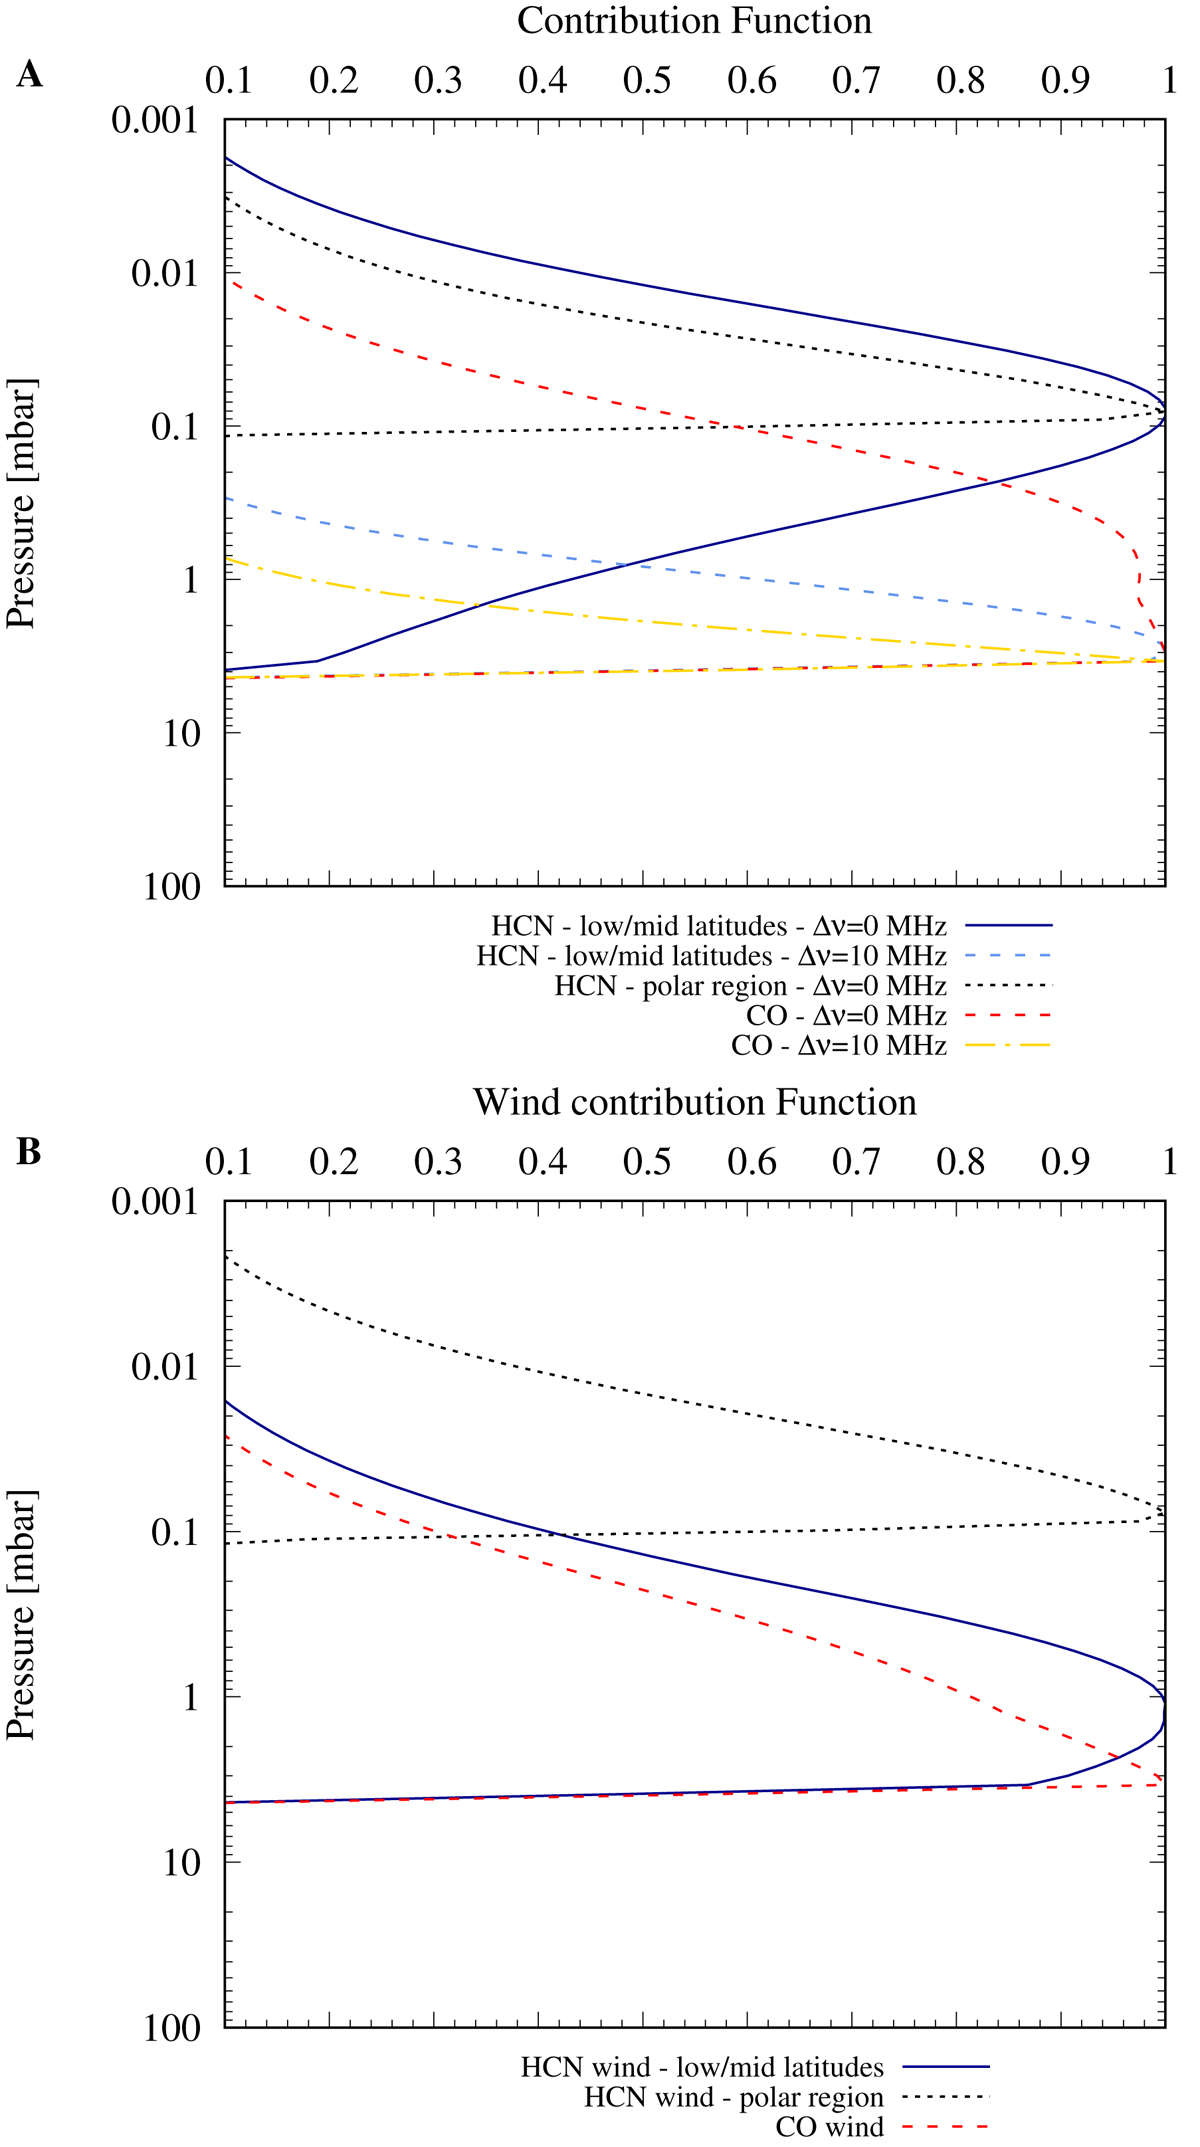
Contribution and wind contribution functions. A: contribution functions of the HCN and CO lines at Jupiter’s limb at the spectral and spatial resolutions of the observations. They are computed for different frequency offsets from the line center. For HCN, different locations (low-to-mid latitudes and polar regions) are presented. For CO, the contribution functions are similar regardless of the latitude. B: wind contribution functions for HCN at low-to-mid (solid blue line) and polar latitudes (dotted black line) and for CO at any latitude (dashed red line).
Current usage metrics show cumulative count of Article Views (full-text article views including HTML views, PDF and ePub downloads, according to the available data) and Abstracts Views on Vision4Press platform.
Data correspond to usage on the plateform after 2015. The current usage metrics is available 48-96 hours after online publication and is updated daily on week days.
Initial download of the metrics may take a while.