Fig. 3.
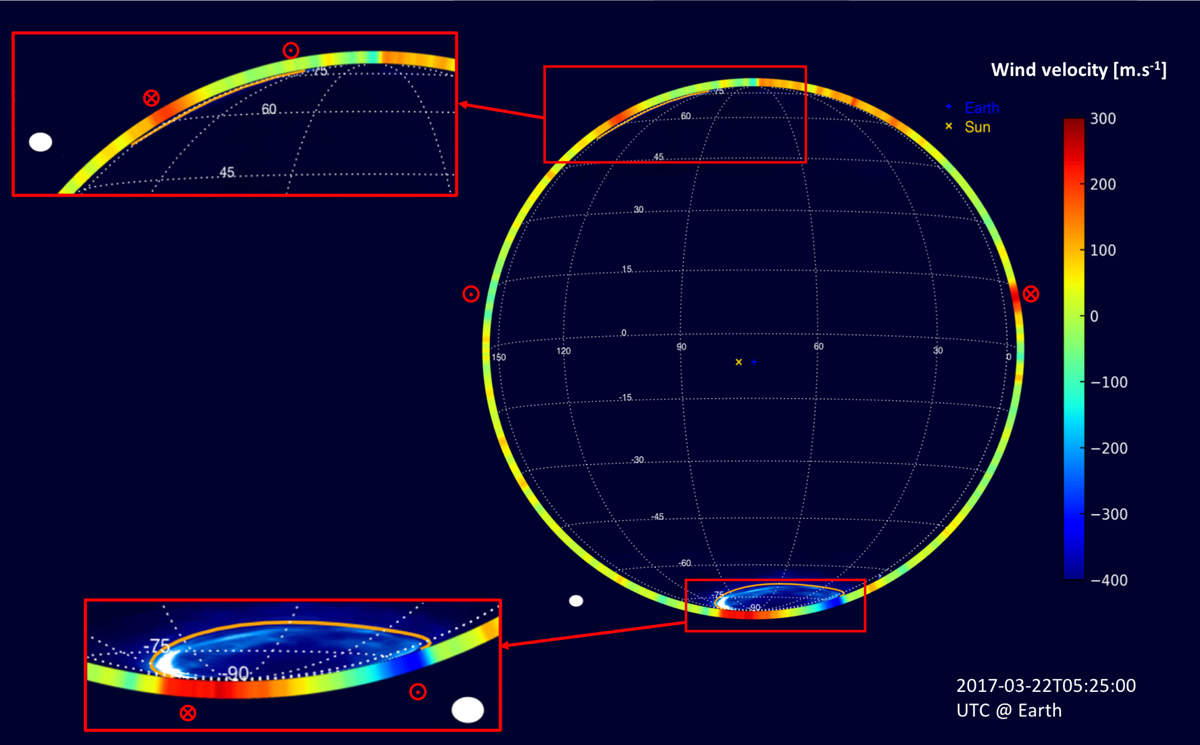
Jupiter’s UV aurora and stratospheric HCN winds. This composite image shows the LOS wind velocities (in m s−1) derived from the ALMA observations and the statistical emission of the aurorae (Clarke et al. 2009) in the configuration of the ALMA observations. The northern and southern aurora regions are best seen in the dedicated zoomed-in quadrants. The M = 30 footprints of the magnetic field model from Connerney et al. (2018) are good markers of the positions of the main ovals as seen by Juno-UVS (Gladstone et al. 2017) and are plotted in orange. The white ellipses indicate the spatial resolution of the ALMA observations. The directions of the strongest winds in the equatorial and auroral regions are indicated with the red ⊙ and ⊗ symbols.
Current usage metrics show cumulative count of Article Views (full-text article views including HTML views, PDF and ePub downloads, according to the available data) and Abstracts Views on Vision4Press platform.
Data correspond to usage on the plateform after 2015. The current usage metrics is available 48-96 hours after online publication and is updated daily on week days.
Initial download of the metrics may take a while.