Fig. 1.
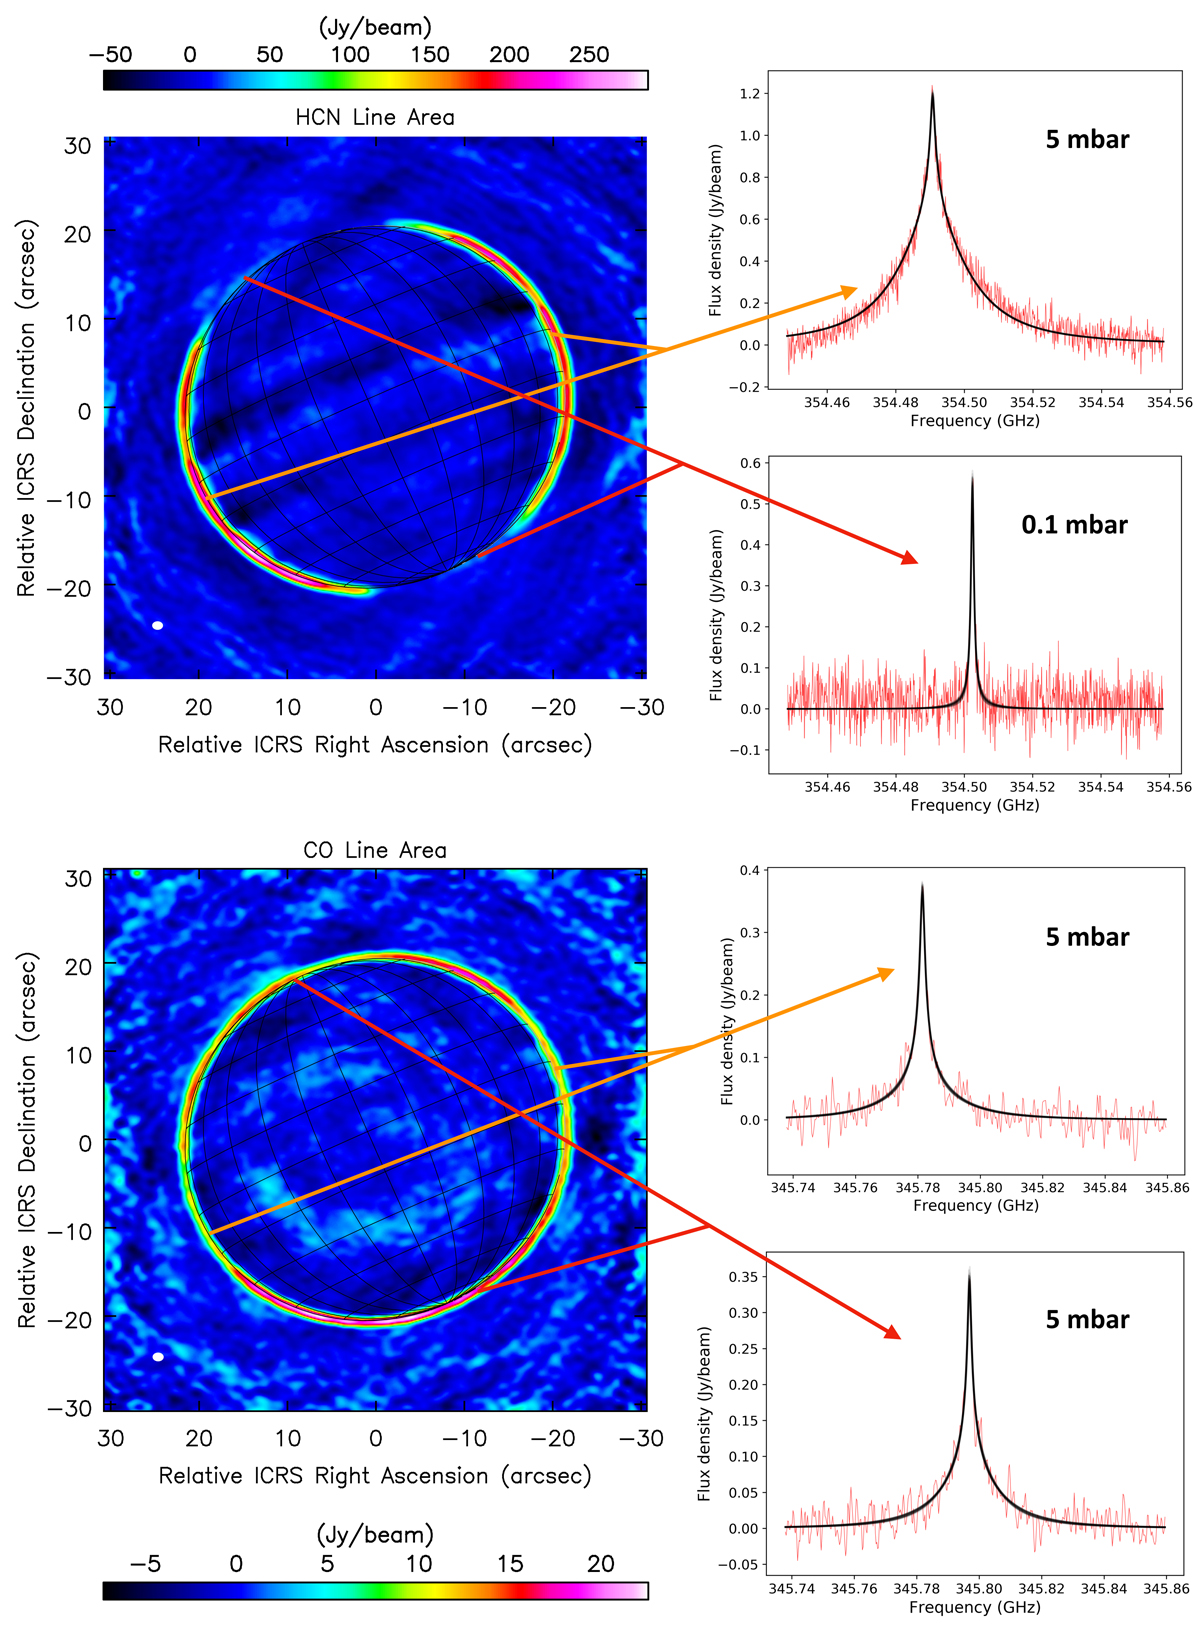
ALMA observations of Jupiter’s stratospheric HCN and CO. Left: line area maps of the HCN (5−4) (top) and CO (3−2) (bottom) emission at the limb of Jupiter. Right: spectra extracted from the data cubes (red lines), showing typical line shapes and the cutoff pressure (p0) in the species vertical profile to reproduce the line width, with the 30 best-fit spectra computed with the MCMC procedure from the parametrized line shape. Observable Doppler shifts with respect to the line rest frequencies are caused by the planet’s rapid rotation and the local east-west winds.
Current usage metrics show cumulative count of Article Views (full-text article views including HTML views, PDF and ePub downloads, according to the available data) and Abstracts Views on Vision4Press platform.
Data correspond to usage on the plateform after 2015. The current usage metrics is available 48-96 hours after online publication and is updated daily on week days.
Initial download of the metrics may take a while.