Fig. 5
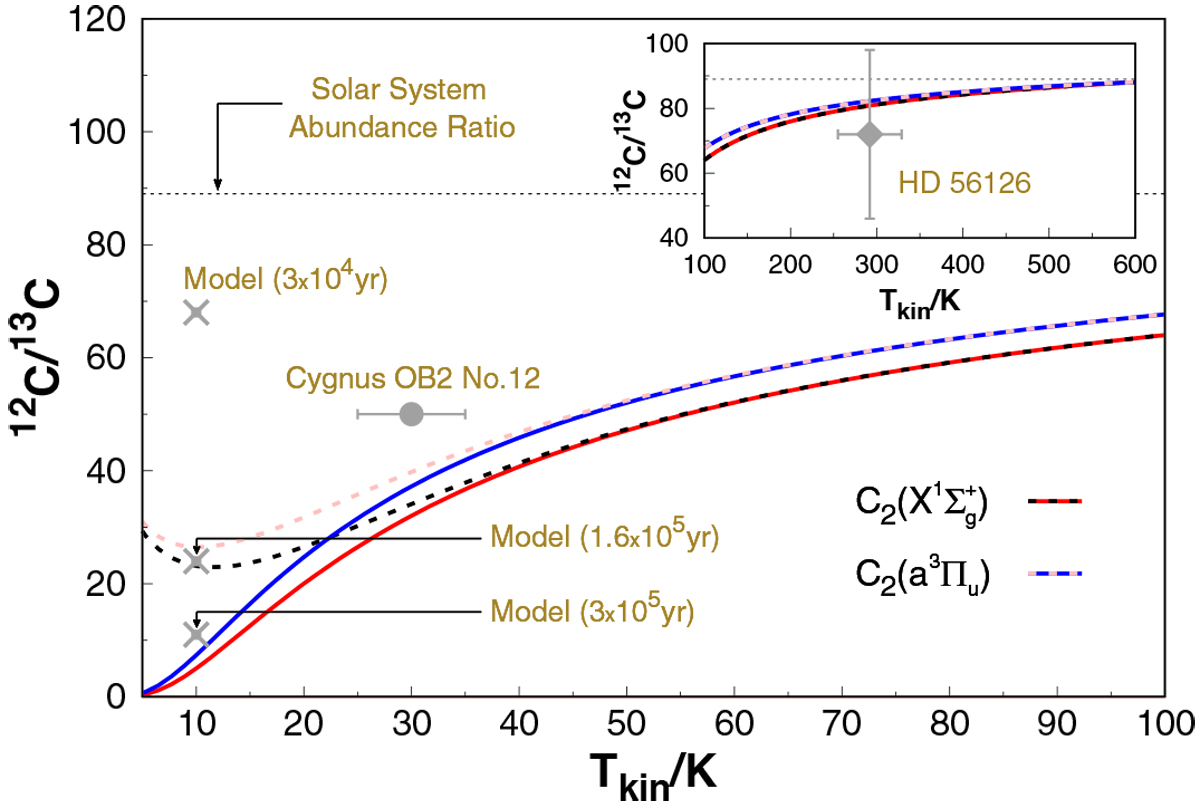
Variation of the 12C/13C isotope ratios derived from ![]() and C2 (a3Πu) (by means of reactions (2) and (4), respectively) as a function of the gas kinetic temperature (Tkin). Solid (blue and red) lines represent the theoretical values calculated from Eq. (18) assuming chemical equilibrium conditions, while the corresponding (pink and back) dashed lines show their behavior as obtained from a reduced kinetic model with fixed integration time of
1.6 × 10⁵ yr (see text). Also shown by the gray points (with error bars) are the corresponding values obtained from observational surveys conducted by Hamano et al. (2019) and Bakker & Lambert (1998) towards Cyg OB2 No. 12 and HD 56126, respectively, as well as those reported by Colzi et al. (2020) for
10 K using a gas-grain chemical model in three different simulation timescales. The horizontal dashed line (also in the inset) highlights the elemental [12C/13C] Solar System abundance ratio.
and C2 (a3Πu) (by means of reactions (2) and (4), respectively) as a function of the gas kinetic temperature (Tkin). Solid (blue and red) lines represent the theoretical values calculated from Eq. (18) assuming chemical equilibrium conditions, while the corresponding (pink and back) dashed lines show their behavior as obtained from a reduced kinetic model with fixed integration time of
1.6 × 10⁵ yr (see text). Also shown by the gray points (with error bars) are the corresponding values obtained from observational surveys conducted by Hamano et al. (2019) and Bakker & Lambert (1998) towards Cyg OB2 No. 12 and HD 56126, respectively, as well as those reported by Colzi et al. (2020) for
10 K using a gas-grain chemical model in three different simulation timescales. The horizontal dashed line (also in the inset) highlights the elemental [12C/13C] Solar System abundance ratio.
Current usage metrics show cumulative count of Article Views (full-text article views including HTML views, PDF and ePub downloads, according to the available data) and Abstracts Views on Vision4Press platform.
Data correspond to usage on the plateform after 2015. The current usage metrics is available 48-96 hours after online publication and is updated daily on week days.
Initial download of the metrics may take a while.