Fig. 4
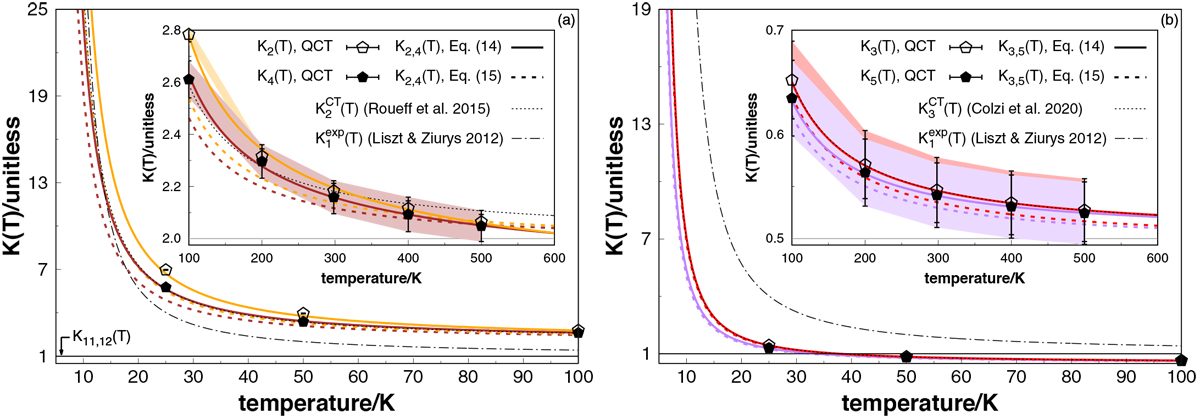
Equilibrium constants and associated error bars for the reactions (a) ![]() (Eq. (2), K2 = k2∕k-2) and
(Eq. (2), K2 = k2∕k-2) and ![]() (Eq. (4), K4 = k4∕k-4); (b)
(Eq. (4), K4 = k4∕k-4); (b) ![]() (Eq. (3), K3 = k3∕k-3) and
(Eq. (3), K3 = k3∕k-3) and ![]() (Eq. (5), K5 = k5∕k-5) at temperatures up to 600 K. Points and solid thick lines are obtained from Eq. (14) using the QCT thermally averaged rates and their analytic forms in Eq. (13), respectively, while dashed thick lines represent theoretical estimates based on statistical mechanics (Eq. (15)). Also shown are the corresponding values predicted via capture theory (Roueff et al. 2015; Colzi et al. 2020) for reactions (2) and (3) and experimental data (exp) for
13 C+ +12CO⇌13CO + 12C+
(Eq. (1), K1 = k1∕k-1) as taken from Liszt & Ziurys (2012). For clarity, the K
values for the thermoneutral reactions (11) and (12) are also indicated. High-temperature limits are represented by gray solid lines.
(Eq. (5), K5 = k5∕k-5) at temperatures up to 600 K. Points and solid thick lines are obtained from Eq. (14) using the QCT thermally averaged rates and their analytic forms in Eq. (13), respectively, while dashed thick lines represent theoretical estimates based on statistical mechanics (Eq. (15)). Also shown are the corresponding values predicted via capture theory (Roueff et al. 2015; Colzi et al. 2020) for reactions (2) and (3) and experimental data (exp) for
13 C+ +12CO⇌13CO + 12C+
(Eq. (1), K1 = k1∕k-1) as taken from Liszt & Ziurys (2012). For clarity, the K
values for the thermoneutral reactions (11) and (12) are also indicated. High-temperature limits are represented by gray solid lines.
Current usage metrics show cumulative count of Article Views (full-text article views including HTML views, PDF and ePub downloads, according to the available data) and Abstracts Views on Vision4Press platform.
Data correspond to usage on the plateform after 2015. The current usage metrics is available 48-96 hours after online publication and is updated daily on week days.
Initial download of the metrics may take a while.