Fig. 3
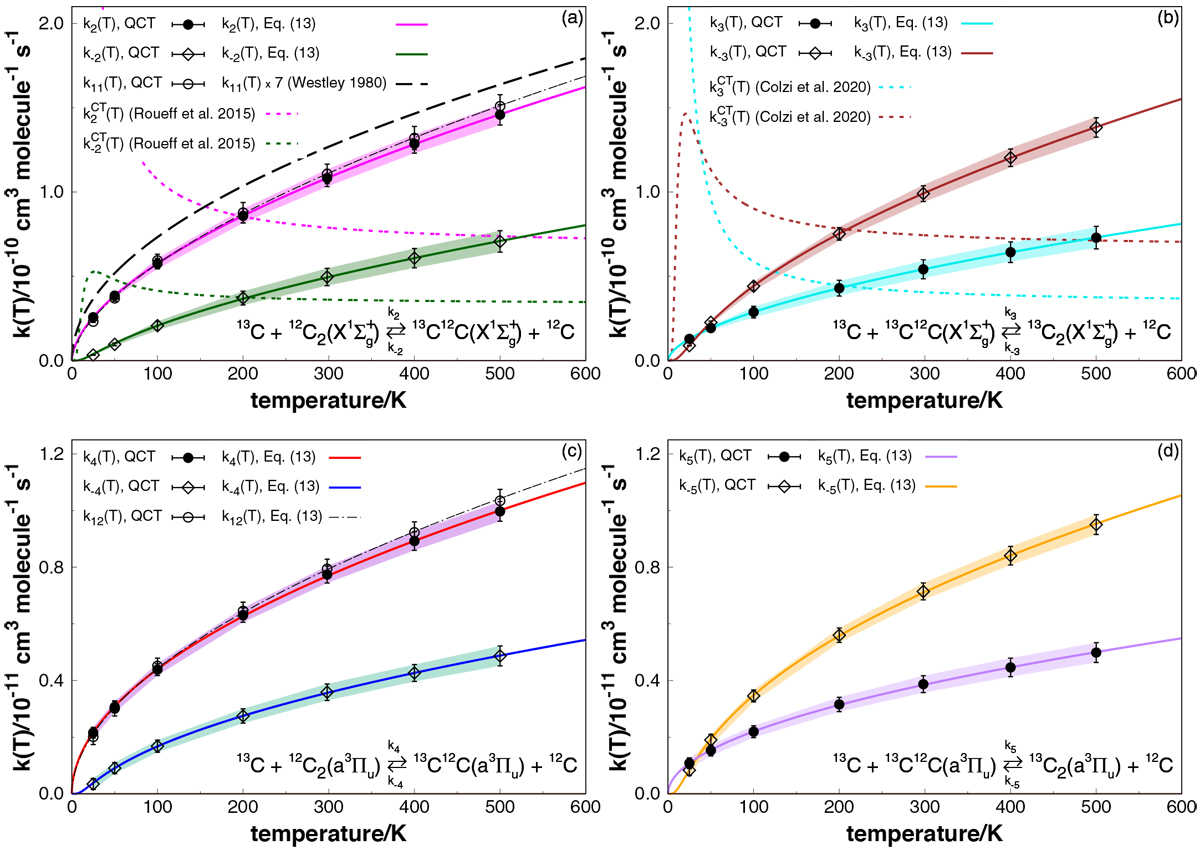
Forward and backward thermal rate coefficients and associated error bars for the reactions (a) ![]() (Eq. (2), k2,- 2); (b)
(Eq. (2), k2,- 2); (b) ![]() (Eq. (3), k3,- 3); (c)
(Eq. (3), k3,- 3); (c) ![]() (Eq. (4), k4,- 4); (d)
(Eq. (4), k4,- 4); (d) ![]() (Eq. (5), k5,- 5) at temperatures up to 600 K. Also shown are the QCT values obtained for the
(Eq. (5), k5,- 5) at temperatures up to 600 K. Also shown are the QCT values obtained for the ![]() atom-exchange reactions (Eqs. (11) and (12)) and available results from the literature (Roueff et al. 2015; Colzi et al. 2020; Westley 1980); CT stands for capture theory (Georgievskii & Klippenstein 2005). Solid thick lines show the predicted QCT thermally averaged rates using the Arrhenius-Kooij formula of Eq. (13).
atom-exchange reactions (Eqs. (11) and (12)) and available results from the literature (Roueff et al. 2015; Colzi et al. 2020; Westley 1980); CT stands for capture theory (Georgievskii & Klippenstein 2005). Solid thick lines show the predicted QCT thermally averaged rates using the Arrhenius-Kooij formula of Eq. (13).
Current usage metrics show cumulative count of Article Views (full-text article views including HTML views, PDF and ePub downloads, according to the available data) and Abstracts Views on Vision4Press platform.
Data correspond to usage on the plateform after 2015. The current usage metrics is available 48-96 hours after online publication and is updated daily on week days.
Initial download of the metrics may take a while.