| Issue |
A&A
Volume 647, March 2021
|
|
|---|---|---|
| Article Number | A127 | |
| Number of page(s) | 13 | |
| Section | Atomic, molecular, and nuclear data | |
| DOI | https://doi.org/10.1051/0004-6361/202039985 | |
| Published online | 22 March 2021 | |
Photodissociation branching ratios of 12C16O from 110 500 to 113 045 cm−1: first observation of the C(1S) channel★
1
Beijing National Laboratory for Molecular Sciences (BNLMS), Institute of Chemistry, Chinese Academy of Sciences,
Beijing
100190,
PR China
2
University of Chinese Academy of Sciences,
Beijing
100049,
PR China
e-mail: This email address is being protected from spambots. You need JavaScript enabled to view it.
; This email address is being protected from spambots. You need JavaScript enabled to view it.
Received:
25
November
2020
Accepted:
25
January
2021
Abstract
Carbon monoxide (CO) is one of the most abundant molecular species in comets. Its photodissociation by the solar radiation in the vacuum ultraviolet (VUV) region produces excited atomic fragments C(1D), C(1S), and O(1D), which radiate at characteristic wavelengths when they decay to lower states. The fractional rate constants for generating these fragments from CO photodissociation under the entire range of the solar radiation field are key input values in modelling the observed atomic emission intensities from comets. In this study, the branching ratios of the four lowest dissociation channels C(3P)+O(3P), C(1D)+O(3P), C(3P)+O(1D), and C(1S)+O(3P) of the 12C16O photodissociation are measured in the VUV energy range between the threshold of producing the C(1S)+O(3P) channel (~110 500 cm−1) and the ionisation energy (IE) of 12C16O (~113 045 cm−1). We measured these ratios using the VUV time-slice velocity-map ion imaging apparatus. We observe a number of high Rydberg states in the aforementioned energy range, with most of them mainly producing ground C(3P) and O(3P) atomic fragments, and only a few of them producing a significant amount of excited C(1D) or O(1D) fragments. We also observe the excited C(1S) fragment from CO photodissociation and measured its branching ratio for the first time. Based on the photodissociation branching ratios measured in the current and previous studies, we are able to estimate the relative percentages of the excited atomic fragments C(1D), C(1S), and O(1D) from the solar photolysis of 12C16O below its IE. We discuss the implications for the photochemical modelling of the CO-dominated comet C/2016 R2 (Pan-STARRS).
Key words: molecular data / comets: general / planets and satellites: atmospheres / Sun: UV radiation / ISM: molecules
The C+ ion photofragment spectrum is only available at the CDS via anonymous ftp to cdsarc.u-strasbg.fr (130.79.128.5) or via http://cdsarc.u-strasbg.fr/viz-bin/cat/J/A+A/647/A127
© ESO 2021
1 Introduction
As the second-most abundant molecular species in the Universe, the photoabsorption and photodissociation of carbon monoxide (CO) in the vacuum ultraviolet (VUV) region play a key role in determining the photochemical properties of interstellar and circumstellar mediums (van Dishoeck & Black 1988; Visser et al. 2009). The isotope-dependent photoabsorption and photodissociation properties of different CO isotopologs are believed to be among the most plausible reasons for the anomalous C and O isotope distributions as observed in various early Solar System objects (Clayton 2002; Lyons et al. 2018; Lyons & Young 2005; Yurimoto & Kuramoto 2004). This makes CO one of the most studied molecules, mainly through a range of high-resolution spectroscopic methods, which determine the accurate absorption line positions and strengths, photodissociation cross-sections, and the isotope effects (Eidelsberg et al. 2017, 2014, 2012, 1991).
Aside from its extensive presence in the interstellar and the circumstellar medium, CO is also a minor species in most cometary comae (Mumma & Charnley 2011) and planetary atmospheres (McElroy & McConnell 1971; Raghuram & Bhardwaj 2020). Comets are believed to contain the most pristine materials originating from the formation stage of the Solar System, thus, investigations of the detailed molecular contents of comets can provide clues about the initial formation conditions of the Solar System. Except for a rare few, for example, the comet 67P/Churyumov-Gerasimenko, for which in situ measurements of its coma materials have been obtained by using the high-resolution mass spectrometer onboard theRosetta spacecraft (Bieler et al. 2015), remote spectroscopic observation of the characteristic atomic and molecular emissions through ground- or space-based telescopes is the most common method for studying comets. When comets get close to the Sun, their gaseous comae are dominated by fragment species produced by the solar radiation photolysis of the parent molecules, which are sublimated from the icy nucleus of the comet by the solar heating. Studying the characteristic emissions from the photodissociated fragment species is one of the most important ways of obtaining the molecular contents of the cometary comae (Feldman et al. 2004). To correctly deduce the parent molecular densities from observing the corresponding fragment species, photochemical modelling with accurate atomic and molecular parameters is essential; the molecular photodissociation cross-sections and branching ratios are among the most important ones (Bhardwaj & Raghuram 2012; Raghuram et al. 2020). Despite their importance, accurate determinations of these molecular parameters are experimentally challenging, which has led to broad discrepancies between photochemical modelling and astronomical observation (Raghuram et al. 2020).
While most cometary comae are dominated by H2O, several exceptions have been discovered recently, such as the 29P/Schwassmann-Wachmann 1 Comet (Ootsubo et al. 2012), C/2016 R2 (Pan-STARRS) Comet (Cochran & McKay 2018), and the first interstellar comet 2I/Borisov (Bodewits et al. 2020; Cordiner et al. 2020). Instead of H2O, in these cases, CO was found to be the dominant component. For C/2016 R2, several high-resolution spectroscopic observations have been carried out, and its coma was found to be rich in CO, N2, and CO2 but depleted in H2O (Biver et al. 2018; Cochran & McKay 2018; McKay et al. 2019; Opitom et al. 2019). Several forbidden atomic emission lines from O, C, and N have been observed, which are attributed to the photolysis of CO, N2, and CO2 via solar radiation (Opitom et al. 2019; Raghuram et al. 2020). In their study, Raghuram et al. simulated the atomic O, C and N emission line intensities and their relative ratios, while the simulated results showed a broad discrepancy with regard to the astronomical observations, which they attributed to the poorly determined photodissociation cross-sections of CO and CO2 for producing those excited C and O atomic fragments (Raghuram et al. 2020). They also simulated the emission intensity from the excited C(1 S) for the first time, even though its production rate from the photodissociation of CO has not yet been experimentally determined to date.
Due to the great deal of potential applications for simulating the chemical properties of the interstellar medium, the photodissociation branching fractions of 12 C16O for producing excited O(1D) and C(1D) have been measured by Jackson, Ng, Gao, and their colleagues in the VUV wavelength range of 91.10–99.50 nm (Chi et al. 2021; Gao et al. 2013, 2012, 2011; Guan et al. 2020; Shi et al. 2018). Because of the saturated absorption by H atoms, the photochemical properties of molecules at VUV wavelengths that are shorter than 91.17 nm (the IE of H) are usually considered to be irrelevant with regard to the chemical properties of the interstellar medium. However, this is not the case for comets when they are close to the Sun since the solar radiation could extend to wavelengths that are much shorter than 91.17 nm. Motivated by the photochemical modelling of Raghuram et al. (2020), we continue to measure the photodissociation branching ratios of 12 C16O from the threshold of producing the excited C(1S) fragment to its ionisation limit in this study. To the best of our knowledge, this is the first time that the branching fractions of the excited C(1 S) fragment are determined. We will briefly discuss how these branching ratio measurements for the VUV photodissociation of 12 C16O can affect the photochemical modelling of the atomic forbidden emission intensities and their relative ratios as presented in Raghuram et al. (2020).
2 Experimental method
The experiments in this study were carried out using a time-slice velocity-map ion imaging (TS-VMI) apparatus equipped with a tunable VUV laser radiation source, which has previously been described in detail (Jiang et al. 2019a,b; Qi et al. 2018). Briefly, a pulsed supersonic molecular beam of pure 12 C16O (Yuan-Hua in China, 12 C16O > 99%), with a rotational temperature of 30–50 K, is produced by a Parker general valve (Series 9) that has a nozzle diameter of 0.5 mm, operating at a total stagnation pressure of 30 psi and a repetition rate of 10 Hz. After passing through two conical skimmers (diameter of the aperture = 2 mm), the 12 C16O molecular beam enters the photodissociation and photoionisation (PD-PI) region of the TS-VMI apparatus, where it crosses the VUV beam in a perpendicular direction. The 12 C16O molecules absorb a single sum-frequency VUV photon and predissociate to form C and O atoms in various atomic states. The C atoms in 3 P, 1 D or 1 S states that are thus produced are photoionised directly by absorbing a second sum-frequency VUV photon in the same laser pulse. After a 120 mm long flight, C+ ions are mapped onto an imaging detection system, which consists of two 50 mm microchannel plates (MCPs), a P47 phosphor screen, and a CCD camera.
The tunable VUV laser radiation is generated by the two-photon resonance-enhanced four-wave mixing process using pulsed Xe gas as the nonlinear medium. The UV laser (ω1) is fixed at 222.568 nm which is resonant with the two-photon transition of Xe at 89 860.015 cm−1 : (5p)5 (2P1∕2)6p2[1/2](J = 0) ← (5p)6 1 S0. It is generated by the frequency doubled output of a dye laser (Sirah, Cobra-Stretch), which is pumped by the third harmonic output (355 nm) of a 10 Hz Nd:YAG laser (Quanta-Ray, Pro-270-10E). The visible laser (ω2) is generated by a second dye laser (Sirah, Cobra-Stretch), which is pumped by the third harmonic output (355nm) of another 10 Hz Nd:YAG laser (Continuum, Surelite EX). It is scanned from 432 nm to 485 nm to generate the needed tunable sum-frequency VUV (2ω1 +ω2) laser between 110 500 and 113 045 cm−1. The exact wavelength of the visible laser (ω2) is monitored by a wavemeter (HighFinesse WS-6). A dichroic mirror combines the UV (ω1) and visible (ω2) laser beams, which are then focused via two plano-convex lenses, both with f = 600 mm, into a T-shaped channel when the Xe gas is pulsed in. All wavelength components thus generated, including ω1, ω2, difference-frequency VUV (2ω1 -ω2), sum-frequency VUV (2ω1 +ω2), and the tripling VUV (3ω1), propagate into the PD-PI region, because no dispersion apparatuses between the T-shape channel and the PD-PI region are used. All the laser beams are not focused on the PD-PI region, thus, the multiphoton ionisation of the C atom is negligibly weak. We have optimised the focus condition of the UV laser (ω1), so that photoionisation of the C atom by the tripling VUV (3ω1) is also negligible.
We first scan the VUV photon energy and monitor the intensity variation of the C+ ion signal in the time-of-flight mass spectrum, the C+ ion photofragment spectra are obtained. We then fix the VUV photon energy to each of the peak positions as identified in the C+ ion photofragment spectra, and accumulate the image for enough signal-to-noise ratios. The branching ratios of different photodissociation channels can be deduced by integrating the corresponding peaks in the total kinetic energy release (TKER) spectra converted from the TS-VMI images after normalisation with respect to the photoionisation cross-sections of C(3 P), C(1 D), and C(1S). In the following, we discuss its influence on the determination of the quantum yields of C(1 D), C(1 S), and O(1 D) from the solar photolysis of CO in cometary comae.
3 Results of the experiments
In the VUV wavelength range of the current study, 12 C16O can dissociate into the following four energetically available channels:
CO(X1Σ+) + hνVUV,
→ C(3 P)+O(3P), hνVUV ≥ 11.11eV (Kepa et al. 2014),
→ C(1 D)+O(3P), hνVUV ≥ 12.37eV,
→ C(3 P)+O(1D), hνVUV ≥ 13.08eV,
→ C(1 S)+O(3P), hνVUV ≥ 13.79eV.
The dissociation energy of the CO molecule is calculated as 89 597.3 ± 6.0 cm−1 (11.11eV) (Kepa et al. 2014), while the thresholds of other three channels are calculated according to the atomic energy level data from NIST. Except for the ground channel C(3 P)+O(3P), all the other three are spin-forbidden channels. In previous studies, the photodissociation branching ratios into the three lowest channels C(3 P)+O(3P), C(1 D)+O(3P), and C(3 P)+O(1D) have been systematically measured in the VUV wavelength range of 91.10–99.50 nm (Chi et al. 2021; Gao et al. 2013, 2012, 2011; Guan et al. 2020; Shi et al. 2018), while the threshold of the channel for generating the excited C(1 S) fragment is at ~13.79eV, which has never been reached before. In this study, we collected the C+ ion photofragment spectra and measured the photodissociation branching ratios into the above four channels in the energy range above 13.79eV and below the IE of 12 C16O.
The overall C+ ion photofragment spectra of 12 C16O obtained inthe VUV energy region from 110 500 to 113 045 cm−1 in this study are shown in Fig. 1d. Because no single laser dye can cover the whole energy range, several different laser dyes are used. In Fig. 1d, we directly connected several segments of spectra collected by using different laser dyes without calibrating their relative intensities. Thus, only the peak positions and line widths are useful here. We have put the measured C+ ion spectrum shown in Fig. 1d at the CDS. As the density of Rydberg states becomes large in the vicinity below the ionisation limit, and the l-uncoupling effect becomes prominent, which makes the coupling scheme change from Hund’s case (b) to (d) (Okazaki et al. 2001), a detailed analysis and accurate spectroscopic assignment for each of the peaks in the C+ ion photofragment spectra in Fig. 1d is not a trivial job and is out of the scope of the current study. Here, we mainly focus on the photodissociation branching ratios at the peak positions, which are important for the photochemical modelling ofcometary comae, as shown in Raghuram et al. (2020).
A typical TS-VMI raw image and its corresponding TKER spectrum at the VUV photon energy of 112 298.6 cm−1 are shown in Figs. 2a and b, respectively. The four rings with decreasing size of radii in Fig. 2a correspond to the peaks with TKERs of ~2.80, ~1.55, ~0.85, and ~0.12 eV in the TKER spectrum of Fig. 2b, respectively. By using the conservation law of total energy, we can assign the above four channels to C(3 P)+O(3P), C(1 D)+O(3P), C(3 P)+O(1D), and C(1 S)+O(3P), respectively.To the best of our knowledge, this is the first time that formations of the excited C(1 S) fragments through the spin-forbidden dissociation channel C(1 S)+O(3P) of CO have been directly confirmed via experiments. This observation may have a potential impact on the photochemical modelling of cometary comae, which we discussed later further on in this paper.
We integrated the corresponding peaks in the TKER spectrum and corrected them via the different photoionisation cross-sections of C(3 P), C(1 D), and C(1 S), the branching ratios of the four photodissociation channels are thus obtained. The photoionisation cross-section of C(3 P) was measured to be ~16 Mb, with an uncertainty of ~30%, and those of C(1 D) and C(1 S) were calculated to be ~46 Mb and 18 Mb, respectively, in the current energy range with no uncertainties reported to be associated with these values (Burke & Taylor 1979; Cantu et al. 1981). We noticed that the photoionisation cross-sections that are calculated on the basis of two different approximations (length versus velocity, as named in Burke & Taylor 1979) are significantly different from each other, especially for those relating to C(1 D) where a resonance structure is present in the current energy range (Burke & Taylor 1979). We also noticed that a more recent calculation of the photoionisation cross-sections of the C atom as part of the TOPbase project have become available1 and the photoionisation cross-sections of C(1 D) are significantly different from those calculated by Burke & Taylor (1979) in the current energy region. Thus, the photoionisation cross-sections of the C atom we use have very large uncertainties and this is the largest source of uncertainty for the branching ratios determined in the current study. We adopted both of the two above sources of photoionisation cross-section data (see details in Table A.3) to calculate the branching ratios from 110 500 to 113 045 cm−1, which are listed in Table A.1. The results as calibrated by using the photoionisation cross-section data (Burke & Taylor 1979; Cantu et al. 1981) are also plotted in Figs. 1a–c individually for different photodissociation channels. As seen in Table A.1, the branching ratios for the channel of C(1 D) + O(3P) vary a great deal when different sources for the photoionisation cross-section data were used, this is mainly because the photoionisation cross-sections of C(1 D) from the two sources are significantly different from each other. The uncertainties, as listed in Table A.1, are the standard deviations (1σ) of between three and five independent measurements, which do not include contributions from possible systematic uncertainties and the uncertainties of the photoionisation cross-sections, as discussed above. Experimental factors, such as slightly different slicing durations on the MCP detector, non-uniform efficiency across the whole active area of the MCP detector, and so on, can cause systematic uncertainties, which have been estimated to be ~5% in our previous study (Chi et al. 2020).
As shown in Figs. 1a–c, the ground channel C(3 P)+O(3P) dominates the predissociation process of 12 C16O for most of the absorption bands in the studied energy range, it is only in several discrete narrow energy ranges that the spin-forbidden channels C(1 D)+O(3P) and C(3 P)+O(1D) are open. This is consistent with our recent study by using two independent tunable VUV beams, where C(3 P2) and C(3 P0) are state-selectively photoionised (Gao et al. 2020). The branching ratios in the channel for generating the excited C(1 S) fragment are small but detectable at many absorption bands in the studied energy range, as shown in Fig. 1c. In the following, we look into the three energy regions, namely, 110 900–111 440, 111 930–112 200, and 112 200–113 050 cm−1 in detail, where the spin-forbidden channels are prominent.
The detailed C+ ion photofragment spectrum in the energy region of 110 900–111 440 cm−1 and the branching ratios in the three spin-forbidden channels are present in Figs. 3d, a, b, and c, respectively. In this energy range, there are three particular areas at around ~111000, ~111240, and ~111360 cm−1, where 12 C16O dissociates substantially into the spin-forbidden channels C(1 D)+O(3P), and C(3 P)+O(1D). This is precisely in accordance with recently published results by using two independent tunable VUV beams (Gao et al. 2020). The three strong bands above are due to absorptions in the Rydberg complexes 8pσ/8pπ (ν′ = 0), (B2 Σ+)3sσ/ 1 Σ+ (ν′ = 1), and 6pσ/6pπ (ν′ = 1) from the ground state, respectively (Casey 1978; Komatsu et al. 1995; Okazaki et al. 2001). This study confirms that the spin-orbit interaction at these three quantum states is strong, leading to prominent dissociation into the spin-forbidden channels. The threshold of the channel C(1 S)+O(3P) is at 111 245.3−111 472.3 cm−1, thus, the 8pσ/8pπ (ν′ = 0) and (B2 Σ+)3sσ 1 Σ+ (ν′ = 1) state does not have enough energy to produce the excited C(1 S) fragment, even though substantial dissociations into the two lower spin-forbidden channels C(1 D)+O(3P) and C(3 P)+O(1D) are observed. The lowest absorption band that produces detectable excited C(1 S) fragments is the band of 6pσ/6pπ (ν′ = 1) at ~111360 cm−1, as shown in Fig. 3c. This band also dissociates substantially into the lower two spin-forbidden channels as shown in Figs. 3a and b. This observation is consistent with the recent study by using two independent tunable VUV beams (Gao et al. 2020).
Figure 4 presents the C+ ion photofragment spectrum and the corresponding photodissociation branching ratios in the energy region of 111 930–112 200 cm−1 in detail. The absorption bands corresponding to the Rydberg states 11p (ν′ = 0), 12p (ν′ = 0), 6dσ (ν′ = 1), 6f (ν′ = 1), and a 1Σ+ state are located in this region (Komatsu et al. 1995, 1993; Okazaki et al. 2001). As shown in Figs. 4a–c, most of the absorption peaks in this energy region show weak but detectable (less than ~2%) dissociation into all three spin-forbidden channels.
The detailed C+ ion photofragment spectrum and the branching ratios into the three spin-forbidden channels from ~112 200 cm−1 to the IE of 12 C16O are present in Fig. 5. This energy region contains many high members of np Rydberg series with ν′ = 0 converging to the first ionisation limit of 12 C16O as shown in Fig. 5d (Okazaki et al. 2001). As shown in Figs. 5a and b, the absorption bands corresponding to 13p(ν′ = 0), 17p-18p(ν′ = 0), 22p(ν′ = 0), and high Rydberg series at ~112 940 cm−1 all dissociate substantially into the spin-forbidden channels C(1 D)+O(3P) and C(3 P)+O(1D). This is consistent with a recent study using two independent tunable VUV beams (Gao et al. 2020). In all these states, dissociation into the channel C(1 S)+O(3P) also becomes prominent as shown in Fig. 5c. This indicates that the spin-orbit interaction at these states becomes strong and lead to dissociation into all the three spin-forbidden channels.
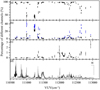 |
Fig. 1 Photodissociation branching ratios of 12C16O into the channel (a) C(3 P) + O(3 P); (b) C(1 D) + O(3 P) (black) and C(3P) + O(1 D) (blue); (c) C(1 S) + O(3 P); (d) C+ ion photofragment spectrum in the photon energy range 110 500–113 045 cm−1. The drop line indicates the position of the ionisation energy of 12C16O at 113 031.3 cm−1 (Erman et al. 1993). The photoionisation cross-sections used are from Burke & Taylor (1979) and Cantu et al. (1981). The error bars represent the standard deviations (1σ) of 3–5 independent measurements. The relative intensities of the spectrum are not normalised according to the corresponding VUV intensities. See Appendix A for details. |
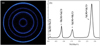 |
Fig. 2 (a) Raw TS-VMI image and (b) corresponding TKER spectrum of 12C16O at 112 298.6 cm−1. The heights of the four peaks are rescaled by setting the highest peak in the TKER spectrum to 1. The underlying areas of the peaks are integrated to obtain the branching ratios of 12 C16O photodissociation after normalisation by using the photoionisation cross-sections of C(3 P), C(1 D), and C(1 S). |
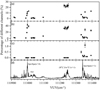 |
Fig. 3 Photodissociation branching ratios of 12C16O into the channel (a) C(1 D) + O(3 P), (b) C(3 P) + O(1 D) and (c) C(1 S) + O(3 P); (d) C+ ion photofragment spectrum in the photon energy range 110 900–111 440 cm−1. The photoionisation cross-sections used are from Burke & Taylor (1979) and Cantu et al. (1981). |
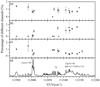 |
Fig. 4 Photodissociation branching ratios of 12C16O into the channel (a) C(1 D) + O(3 P), (b) C(3 P) + O(1 D), and (c) C(1 S) + O(3 P); (d) C+ ion photofragment spectrum in the photon energy range 111 930–112 200 cm−1. The photoionisation cross-sections come from Burke & Taylor (1979) and Cantu et al. (1981). |
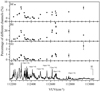 |
Fig. 5 Photodissociation branching ratios of 12C16O into the channel (a) C(1 D) + O(3 P), (b) C(3 P) + O(1 D), and (c) C(1 S) + O(3 P); (d) C+ ion photofragment spectrum in the photon energy range 112 200–113 050 cm−1. The photoionisation cross-sections come from Burke & Taylor (1979) and Cantu et al. (1981). |
4 Quantum yields of C(1D), C(1 S), and O(1 D)
The production rate constants of the excited C, O, and N atomic fragments resulted from the solar radiation photolysis of relevant parent molecules, such as CO, N2, CN, CO2, H2 O, and so on, are among the most important parameters for understanding the photochemical properties of planetary atmospheres and cometary comae (Bhardwaj & Raghuram 2012; Fox 1993; McElroy & McConnell 1971; Raghuram et al. 2020). Given the great importance of this, the photoabsorption and photodissociation cross-sections of those stable molecular species have been measured many times and are, thus, relatively well-documented (Heays et al. 2017). However, the branching ratios for producing each of the excited atomic fragments are poorly determined, which has become one of the main origins of the uncertainty related to quantitative photochemical modelling (Raghuram et al. 2020). As for CO, which is an important source for producing the excited C and O fragments in planetary atmospheres and cometary comae (McElroy & McConnell 1971; Raghuram et al. 2020), it has long been assumed that only spin-allowed channels are active after CO is photoexcited by absorbing a solar photon (Huebner et al. 1992; McElroy & McConnell 1971). Under this assumption, the threshold for producing the excited C(1 D) and O(1 D) fragments is at 86.38 nm, which corresponds to the first excited spin-allowed channel C(1 D)+O(1D); the threshold for producing the excited C(1S) fragment is at 78.65 nm, which corresponds to the spin-allowed channel C(1 S)+O(1D) (McElroy & McConnell 1971). Both of these two thresholds are above the first IE of CO; therefore, most CO molecules are expected to be directly photoionised instead of producing the excited C and O fragments through photodissociation after absorbing solar photons in this energy region.
Thus far, we have performed a series of experimental measurements on the photodissociation branching ratios of CO, including the current study. The photodissociation branching ratios of 12 C16O from the lowest dissociation threshold at ~111.80 nm to its IE at ~88.48 nm have been obtained (Chi et al. 2021; Gao et al. 2013, 2012, 2011; Guan et al. 2020; Jiang et al. 2019a; Shi et al. 2018). The most important finding is that photodissociation into the spin-forbidden channels C(1 D)+O(3P) and C(3 P)+O(1D), which were previously thought not to occur at all, can be as important as the spin-allowed channel C(3 P)+O(3P) at many strong absorption bands. In this study, we show that the excited C(1 S) fragment may also have been produced through the spin-forbidden channel C(1 S)+O(3P). The thresholds of all the three spin-forbidden channels are below the IE of CO and, thus, they could be important sources of the excited C and O fragments in planetary atmospheres and cometary comae. In the following, we will estimate the relative quantum yields of excited C(1 D), C(1 S), and O(1 D) fragments that can be generated from the photodissociation of CO by the solar radiation in the photon energy range below the IE of CO. The influence on the photochemical modelling of the CO-dominated comet C/2016 R2 is briefly discussed below.
The total relative quantum yields (%) of excited C(1D), C(1 S), and O(1 D) fragments generated from the photodissociation of CO by the solar radiation in the photon energy range below the IE of CO can be calculated using the following equation:
 (1)
(1)
where X represents the excited atomic fragments C(1D), C(1 S), and O(1 D), ηX (λ) is the branching ratio of the corresponding atomic fragment of CO photodissociation at a wavelength λ, while σ(λ) is the photodissociation cross-section of CO at wavelength λ and PF(λ) is the solar photon flux at a wavelength λ. The photodissociation cross-sections for CO absorption bands below 110 000 cm−1 are adopted from Eidelsberg & Rostas (1990), Eidelsberg et al. (1991) and those above 110 000 cm−1 are adopted from Letzelter et al. (1987). Due to the relatively low spectroscopic resolution, the integrated photodissociation cross-sections, as measured in Letzelter et al. (1987), are equally distributed to each of the resolved absorption bands by high resolution studies in the specific energy ranges. The photodissociation branching ratios for producing C(1 D), C(1 S), and O(1 D) are from both earlier studies (Chi et al. 2021; Gao et al. 2013, 2012, 2011; Guan et al. 2020; Shi et al. 2018) and the current study (as presented in the previous section). To compare the impact of the different photoionisation cross-section data of the C atom used in the calculation, we also recalculated all the branching ratios from our previous studies by using the photoionisation cross-section data from the TOPbase project (see footnote 1) and we present a comparison of the results in Table A.2. Due to the fact that photodissociation branching ratios can strongly depend on the rotational quantum number within each absorption band, we calculated Eq. (1) by using a minimum and maximum branching ratio value separately to obtain a rough lower and upper limit, respectively, for the quantum yields of the corresponding atomic fragments. The solar photon flux used in this study comes from Huebner et al. (1992) and Del Zanna (2019), which use a higher-resolution solar VUV spectrum. The photodissociation cross-sections, solar photon fluxes, solar spectrum, and photoionisation cross-sections from 88.50 to 108.00 nm, as described above, are listed in Table A.3. There are two points that ought to be kept in mind when the quantum yields deduced in the current study are to be used in future photochemical modelling. Firstly, the rotational population of CO molecules in cometary comae can be very different from those in the supersonic molecular beam used in our experiment, thus, the above-mentioned limits, as calculated in the current study, cannot actually stand as the rigorous upper and lower limits in real cometary comae; secondly, the real quantum yields strongly depend on the level of the solar activity, which is demonstrated as follows.
We named the branching ratios normalised via photoionisation cross-section data from Burke & Taylor (1979) and Cantu et al. (1981) as BR1 and those normalised via photoionisation cross-section data (see footnote 1) as BR2. The solar photon flux from Huebner et al. (1992) and the solar spectrum (of a normalised intensity) from Del Zanna (2019) are labelled as S1 and S2, respectively. The details of these parameters are listed in Tables A.2 and A.3. By substituting all the parameters in Eq. (1), we obtained the quantum yields of C(1 D), C(1 S), and O(1 D) under different conditions, which are listed in Table 1. As seen from Table 1, the use of different branching ratios (or, equivalently, different photoionisation cross-sections of the C atom) has a smaller effect on the calculated quantum yields than that when different solar spectra are used. This shows that the real quantum yields in the cometary comae strongly depend on the level of the solar activity as discussed above. The photoionisation cross-sections from the TOPbase project (see footnote 1) and the solar spectrum (normalised intensity) by Del Zanna (2019) include more recent calculations and measurements; thus, we adopted these values (BR2 and S2) for all the discussions to follow. Under the conditions of BR2 and S2, we find that about 10.31–17.92% and 0.10–0.15% of the total C atomic fragments from solar photodissociation of CO are in the excited 1 D and 1 S states, respectively; and about 9.65–12.35% of the total O atomic fragments from solar photodissociation of CO are in the excited 1 D state, as listed in Table 1.
Calculated quantum yields of C(1D), C(1 S), O(1 D), and C(1 S)/C(1D) from solar photolysis of CO via photoionisation cross-sections of the C atom and the solar spectra from different sources.
5 Implications for the comet C/2016 R2
In the recent photochemical modelling of the CO-dominated comet C/2016 R2 by Raghuram et al. (2020), the modelled emission intensity ratio between C(1D) and N(2D), namely, the [CI]/[NI] ratio, was higher by a factor of about three than that of the observations, which led the authors to conclude that the mean branching ratio of CO for producing C(1 D) should be smaller than the Huebner et al. (1992) values by a factor of between three and five. As discussed above, Huebner et al. (1992) assumed that the only channel at wavelengths shorter than 86.38 nm is C(1 D)+O(1D), and at longer wavelengths is CO only produces C(3 P)+O(3P); however, the current study shows that about 10.31–17.92% of the total C atomic fragments produced by the solar photolysis of CO at wavelengths longer than 88.48 nm are in the excited 1 D state, which can increase the Huebner et al. (1992) production rate of C(1 D) by a factor of one instead of decreasing it as intended by the photochemical modelling of Raghuram et al. (2020). This further confirms that the branching ratio of the channel C(1 D)+O(1D) at wavelengths shorter than 86.38 nm has to be much lower than 100%, as was assumed by Huebner et al. (1992), even after considering the fact that the quantum yield of 0.32 for the production of N(2 D) from the photodissociation of N2 as used by Raghuram et al. (2020) could be much lower than the actual values (Song et al. 2016). Direct experimental measurements of the photodissociation branching ratios of CO at wavelengths shorter than 86.38 nm are needed for more accurate photochemical modelling.
In this study, we confirm, for the first time, that the excited C(1 S) fragment is produced through the spin-forbidden channel C(1 S)+O(3P) and the averaged quantum yield is measured to be 0.10–0.15% if we only consider solar photons with energy smaller than the IE of CO. The relative ratio between C(1 S) and C(1 D) is thus calculated to be 0.54–1.46%, which is in accordance with the required value by the photochemical modelling of Raghuram et al. (2020). This confirms that the C(1 S) and C(1 D) fragments as observed in the comet C/2016 R2 are mainly produced through the solar photolysis of CO, the contributions from other molecular species should be small. The quantum yield of 9.65–12.35% for the production of O(1 D) through the spin-forbidden channel C(3 P)+O(1D) can increase the Huebner et al. (1992) production rate of O(1 D) from CO photodissociation by a factor of two, while this is still much smaller than the production rate of O(1 D) by CO2 photodissociation; thus, the contribution of the spin-forbidden channel C(3 P)+O(1D) of CO photodissociation to the production of O(1D) is negligible, which is in agreement with the findings of Raghuram et al. (2020).
6 Summary
In this study, we collected the C+ ion photofragment spectra and measured the photodissociation branching ratios of CO photodissociation in the energy region from 110 500 to 113 045 cm−1. The spin-forbidden channel C(1S) + O(3P) was observed for the first time and confirmed to be the most important source for the excited atomic C(1 S) fragments as observed in the CO-dominated comet C/2016 R2. Most of the states in the aforementioned energy range dissociate predominantly into the ground state channel and only a few dissociate into the spin-forbidden channels with comparable branching ratios. The three spin-forbidden channels C(1 D) + O(3P), C(3 P) + O(1D), and C(1S) + O(3P) are found tobe relevant to each other at most states, indicating that most spin-orbit interactions on the potential energy curves of CO can lead to dissociation into all the three spin-forbidden channels simultaneously. The averaged quantum yields of the excited atomic C(1 D), C(1 S), and O(1 D) fragments from the solar photolysis of CO at photon energies below the IE of CO are estimated. Our study shows that the production of C(1D) and C(1S) through thespin-forbidden channels of CO photodissociation, which were previously ignored (e.g. Huebner et al. 1992), can play important roles in the coma of C/2016 R2; while the production of O(1 D) through the spin-forbidden channel of CO photodissociation only plays a minor role due to the much larger production rate of O(1 D) via CO2 photodissociation.
According to Cook et al. (1965), the branching ratio of photoionisation is not 100%, even when CO absorbs a photon with energy above its IE, the photodissociation process is still important, producing C and O fragments. Detailed branching ratios of CO photodissociation above its IE, especially those for producing excited C(1 D), C(1 S), and O(1 D) fragments, are important for modelling the photochemical properties of CO-dominated comets, such as C/2016 R2 (Raghuram et al. 2020). An extension of the current work up to the higher energy range above the IE of CO is among our future plans.
Acknowledgements
This work is supported by the National Natural Science Foundation of China (Grant No.21803072), the Program for Young Outstanding Scientists of Institute of Chemistry, Chinese Academy of Science (ICCAS), and Beijing National Laboratory for Molecular Sciences (BNLMS). We thank Prof. Yang Pan (National Synchrotron Radiation Laboratory, University of Science and Technology of China) for instrumentation supports.
Appendix A Additional tables
Photodissociation branching ratios of the channels C(3P) + O(3 P), C(1 D) + O(3 P), C(3 P) + O(1 D), and C(1 S) + O(3 P) for 12 C16O in the photon energy range 110 500–113 045 cm−1 (88.46–90.50 nm).
Branching ratios of 12C16O from 88.5 to 108.00 nm, normalised with two different sources of the photoionisation cross-section data for the C atom.
Photodissociation cross-sections, solar photon fluxes, solar spectrum, and photoionisation cross-sections of the C atom from 88.50 to108.00 nm.
References
- Bhardwaj, A., & Raghuram, S. 2012, ApJ, 748, 13 [NASA ADS] [CrossRef] [Google Scholar]
- Bieler, A., Altwegg, K., Balsiger, H., et al. 2015, Nature, 526, 678 [Google Scholar]
- Biver, N., Bockelée-Morvan, D., Paubert, G., et al. 2018, A&A, 619, A127 [NASA ADS] [CrossRef] [EDP Sciences] [Google Scholar]
- Bodewits, D., Noonan, J. W., Feldman, P. D., et al. 2020, Nat. Astron., 4, 867 [CrossRef] [Google Scholar]
- Burke, P. G., & Taylor, K. T. 1979, J. Phys. B At. Mol. Phys., 12, 2971 [Google Scholar]
- Cantu, A. M., Mazzoni, M., Pettini, M., & Tozzi, G. P. 1981, Phys. Rev. A, 23, 1223 [NASA ADS] [CrossRef] [Google Scholar]
- Casey, M. 1978, Phd thesis, Dublin University of College, Germany [Google Scholar]
- Chi, X., Jiang, P., Zhu, Q., Cheng, M., & Gao, H. 2020, A&A, 637, A37 [EDP Sciences] [Google Scholar]
- Chi, X., Jiang, P., Zhu, Q., Cheng, M., & Gao, H. 2021, Mol. Phys., 119, e1718228 [Google Scholar]
- Clayton, R. N. 2002, Nature, 415, 860 [NASA ADS] [CrossRef] [Google Scholar]
- Cochran, A. L., & McKay, A. J. 2018, ApJ, 854, L10 [NASA ADS] [CrossRef] [Google Scholar]
- Cook, G. R., Metzger, P. H., & Ogawa, M. 1965, Can. J. Phys., 43, 1706 [Google Scholar]
- Cordiner, M. A., Milam, S. N., Biver, N., et al. 2020, Nat. Astron., 4, 861 [CrossRef] [Google Scholar]
- Del Zanna, G. 2019, A&A, 624, A36 [NASA ADS] [CrossRef] [EDP Sciences] [Google Scholar]
- Eidelsberg, M., & Rostas, F. 1990, A&A, 235, 472 [NASA ADS] [Google Scholar]
- Eidelsberg, M., Viala, Y., Rostas, F., & Benayoun, J. 1991, A&AS, 90, 231 [Google Scholar]
- Eidelsberg, M., Lemaire, J. L., Federman, S. R., et al. 2012, A&A, 543, A69 [NASA ADS] [CrossRef] [EDP Sciences] [Google Scholar]
- Eidelsberg, M., Lemaire, J. L., Federman, S. R., et al. 2014, A&A, 566, A96 [NASA ADS] [CrossRef] [EDP Sciences] [Google Scholar]
- Eidelsberg, M., Lemaire, J. L., Federman, S. R., et al. 2017, A&A, 602, A76 [NASA ADS] [CrossRef] [EDP Sciences] [Google Scholar]
- Erman, P., Karawajczyk, A., Rachlew-Källne, E., et al. 1993, Chem. Phys. Lett., 215, 173 [Google Scholar]
- Feldman, P. D., Cochran, A. L., & Combi, M. R. 2004, Comets II (Tucson: University of Arizona Press), 425 [Google Scholar]
- Fox, J. L. 1993, J. Geophys. Res., 98, 3297 [NASA ADS] [CrossRef] [Google Scholar]
- Gao, H., Song, Y., Yang, L., et al. 2011, J. Chem. Phys., 135, 221101 [NASA ADS] [CrossRef] [PubMed] [Google Scholar]
- Gao, H., Song, Y., Yang, L., et al. 2012, J. Chem. Phys., 137, 034305 [NASA ADS] [CrossRef] [Google Scholar]
- Gao, H., Song, Y., Chang, Y.-C., et al. 2013, J. Phys. Chem. A, 117, 6185 [CrossRef] [Google Scholar]
- Gao, H., Song, Y., Jackson, W. M., & Ng, C.-Y. 2020, Chin. J. Chem. Phys., 33, 91 [CrossRef] [Google Scholar]
- Guan, L., Jiang, P., Zhang, G., et al. 2020, J. Phys. Chem. A, 124, 9382 [Google Scholar]
- Heays, A. N., Bosman, A. D., & van Dishoeck, E. F. 2017, A&A, 602, A105 [NASA ADS] [CrossRef] [EDP Sciences] [Google Scholar]
- Huebner, W. F., Keady, J. J., & Lyon, S. P. 1992, Astrophys. Space Sci., 195, 1 [Google Scholar]
- Jiang, P., Chi,X., Qi, W., et al. 2019a, Phys. Chem. Chem. Phys., 21, 14376 [Google Scholar]
- Jiang, P., Chi,X., Zhu, Q., Cheng, M., & Gao, H. 2019b, Nat. Commun., 10, 3175 [NASA ADS] [CrossRef] [Google Scholar]
- Kepa, R., Ostrowska-Kopeć, M., Piotrowska, I., et al. 2014, J. Phys. B At. Mol. Opt. Phys., 47, 045101 [Google Scholar]
- Komatsu, M., Ebata, T., & Mikami, N. 1993, J. Chem. Phys., 99, 9350 [Google Scholar]
- Komatsu, M., Ebata, T., Maeyama, T., & Mikami, N. 1995, J. Chem. Phys., 103, 2420 [Google Scholar]
- Letzelter, C., Eidelsberg, M., Rostas, F., Breton, J., & Thieblemont, B. 1987, Chem. Phys., 114, 273 [NASA ADS] [CrossRef] [Google Scholar]
- Lyons, J. R., & Young, E. D. 2005, Nature, 435, 317 [NASA ADS] [CrossRef] [PubMed] [Google Scholar]
- Lyons, J. R., Gharib-Nezhad, E., & Ayres, T. R. 2018, Nat. Commun., 9, 908 [NASA ADS] [CrossRef] [Google Scholar]
- McElroy, M. B., & McConnell, J. C. 1971, J. Geophys. Res., 76, 6674 [NASA ADS] [CrossRef] [Google Scholar]
- McKay, A. J., DiSanti, M. A., Kelley, M. S. P., et al. 2019, AJ, 158, 128 [Google Scholar]
- Mumma, M. J., & Charnley, S. B. 2011, ARA&A, 49, 471 [NASA ADS] [CrossRef] [Google Scholar]
- Okazaki, A., Ebata, T., & Mikami, N. 2001, J. Chem. Phys., 114, 7886 [NASA ADS] [CrossRef] [Google Scholar]
- Ootsubo, T., Kawakita, H., Hamada, S., et al. 2012, ApJ, 752, 15 [NASA ADS] [CrossRef] [Google Scholar]
- Opitom, C., Hutsemékers, D., Jehin, E., et al. 2019, A&A, 624, A64 [NASA ADS] [CrossRef] [EDP Sciences] [Google Scholar]
- Qi, W., Jiang, P., Lin, D., et al. 2018, Rev. Sci. Instrum., 89, 013101 [Google Scholar]
- Raghuram, S., & Bhardwaj, A. 2020, A&A, 639, A60 [EDP Sciences] [Google Scholar]
- Raghuram, S., Hutsemékers, D., Opitom, C., et al. 2020, A&A, 635, A108 [EDP Sciences] [Google Scholar]
- Shi, X., Gao, H., Yin, Q.-Z., et al. 2018, J. Phys. Chem. A, 122, 8136 [CrossRef] [Google Scholar]
- Song, Y., Gao, H., Chang, Y. C., et al. 2016, ApJ, 819, 23 [NASA ADS] [CrossRef] [Google Scholar]
- van Dishoeck, E. F., & Black, J. H. 1988, ApJ, 334, 771 [Google Scholar]
- Visser, R., van Dishoeck, E. F., & Black, J. H. 2009, A&A, 503, 323 [NASA ADS] [CrossRef] [EDP Sciences] [Google Scholar]
- Yurimoto, H., & Kuramoto, K. 2004, Science, 305, 1763 [NASA ADS] [CrossRef] [PubMed] [Google Scholar]
All Tables
Calculated quantum yields of C(1D), C(1 S), O(1 D), and C(1 S)/C(1D) from solar photolysis of CO via photoionisation cross-sections of the C atom and the solar spectra from different sources.
Photodissociation branching ratios of the channels C(3P) + O(3 P), C(1 D) + O(3 P), C(3 P) + O(1 D), and C(1 S) + O(3 P) for 12 C16O in the photon energy range 110 500–113 045 cm−1 (88.46–90.50 nm).
Branching ratios of 12C16O from 88.5 to 108.00 nm, normalised with two different sources of the photoionisation cross-section data for the C atom.
Photodissociation cross-sections, solar photon fluxes, solar spectrum, and photoionisation cross-sections of the C atom from 88.50 to108.00 nm.
All Figures
|
Fig. 1 Photodissociation branching ratios of 12C16O into the channel (a) C(3 P) + O(3 P); (b) C(1 D) + O(3 P) (black) and C(3P) + O(1 D) (blue); (c) C(1 S) + O(3 P); (d) C+ ion photofragment spectrum in the photon energy range 110 500–113 045 cm−1. The drop line indicates the position of the ionisation energy of 12C16O at 113 031.3 cm−1 (Erman et al. 1993). The photoionisation cross-sections used are from Burke & Taylor (1979) and Cantu et al. (1981). The error bars represent the standard deviations (1σ) of 3–5 independent measurements. The relative intensities of the spectrum are not normalised according to the corresponding VUV intensities. See Appendix A for details. |
| In the text | |
|
Fig. 2 (a) Raw TS-VMI image and (b) corresponding TKER spectrum of 12C16O at 112 298.6 cm−1. The heights of the four peaks are rescaled by setting the highest peak in the TKER spectrum to 1. The underlying areas of the peaks are integrated to obtain the branching ratios of 12 C16O photodissociation after normalisation by using the photoionisation cross-sections of C(3 P), C(1 D), and C(1 S). |
| In the text | |
|
Fig. 3 Photodissociation branching ratios of 12C16O into the channel (a) C(1 D) + O(3 P), (b) C(3 P) + O(1 D) and (c) C(1 S) + O(3 P); (d) C+ ion photofragment spectrum in the photon energy range 110 900–111 440 cm−1. The photoionisation cross-sections used are from Burke & Taylor (1979) and Cantu et al. (1981). |
| In the text | |
|
Fig. 4 Photodissociation branching ratios of 12C16O into the channel (a) C(1 D) + O(3 P), (b) C(3 P) + O(1 D), and (c) C(1 S) + O(3 P); (d) C+ ion photofragment spectrum in the photon energy range 111 930–112 200 cm−1. The photoionisation cross-sections come from Burke & Taylor (1979) and Cantu et al. (1981). |
| In the text | |
|
Fig. 5 Photodissociation branching ratios of 12C16O into the channel (a) C(1 D) + O(3 P), (b) C(3 P) + O(1 D), and (c) C(1 S) + O(3 P); (d) C+ ion photofragment spectrum in the photon energy range 112 200–113 050 cm−1. The photoionisation cross-sections come from Burke & Taylor (1979) and Cantu et al. (1981). |
| In the text | |
Current usage metrics show cumulative count of Article Views (full-text article views including HTML views, PDF and ePub downloads, according to the available data) and Abstracts Views on Vision4Press platform.
Data correspond to usage on the plateform after 2015. The current usage metrics is available 48-96 hours after online publication and is updated daily on week days.
Initial download of the metrics may take a while.