Fig. 2
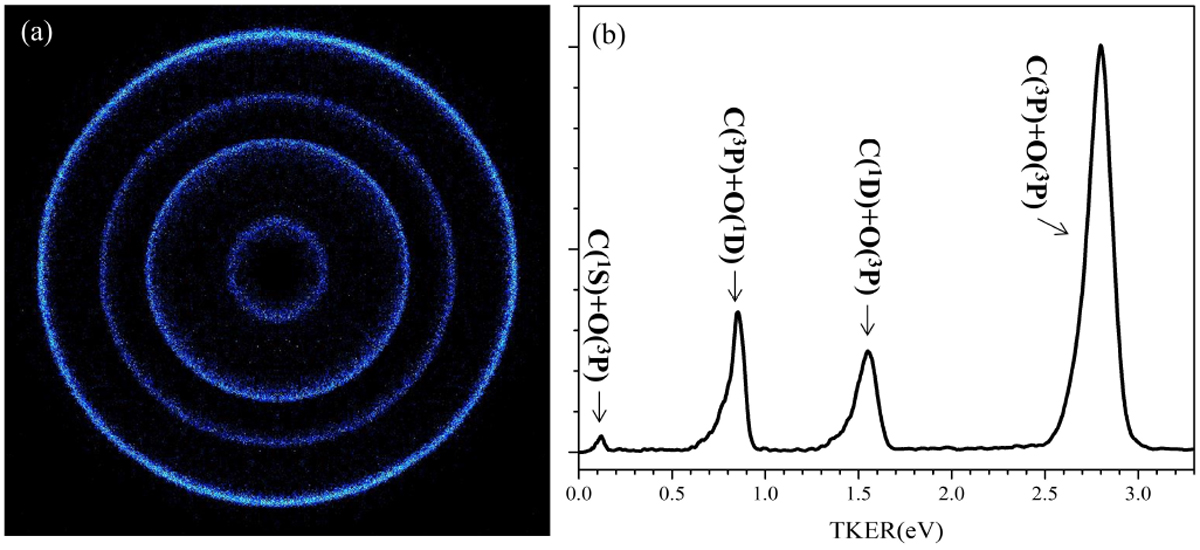
(a) Raw TS-VMI image and (b) corresponding TKER spectrum of 12C16O at 112 298.6 cm−1. The heights of the four peaks are rescaled by setting the highest peak in the TKER spectrum to 1. The underlying areas of the peaks are integrated to obtain the branching ratios of 12 C16O photodissociation after normalisation by using the photoionisation cross-sections of C(3 P), C(1 D), and C(1 S).
Current usage metrics show cumulative count of Article Views (full-text article views including HTML views, PDF and ePub downloads, according to the available data) and Abstracts Views on Vision4Press platform.
Data correspond to usage on the plateform after 2015. The current usage metrics is available 48-96 hours after online publication and is updated daily on week days.
Initial download of the metrics may take a while.