| Issue |
A&A
Volume 674, June 2023
|
|
|---|---|---|
| Article Number | L14 | |
| Number of page(s) | 5 | |
| Section | Letters to the Editor | |
| DOI | https://doi.org/10.1051/0004-6361/202245550 | |
| Published online | 27 June 2023 | |
Letter to the Editor
CO2 as the main parent source of atomic oxygen in comet C/2017 K2 (Pan-STARRS)
1
INAF Astronomical observatory of Padova, Vicolo dell’Osservatorio 5, 35122 Padova, Italy
e-mail: This email address is being protected from spambots. You need JavaScript enabled to view it.
2
INAF Astronomical Observatory of Arcetri, Largo Enrico Fermi 5, 40125 Firenze, Italy
3
Fundación Galileo Galilei-INAF, Rambla José Ana Fernandez Pérez 7, 38712 Breña Baja, TF, Spain
4
Instituto de Astrofisica de Canarias, C/Via Lactea s/n, 38205 La Laguna, Tenerife, Spain
5
Departamento de Astrofisica, Univ. de La Laguna, Av. del Astrofisico Francisco Sánchez s/n, 38205 La Laguna, Tenerife, Spain
Received:
25
November
2022
Accepted:
23
May
2023
Abstract
C/2017 K2 (Pan-STARRS) is an Oort cloud comet discovered in May 2017. Ground observations have revealed that this long-period comet was active at heliocentric distance of 35 au. At such a distance, activity cannot be driven by the sublimation or the exothermic crystallization of water ice. We assume that the activity of comet C/2017 K2 may be driven by the sublimation of super-volatile ices such as CO and CO2. The nature of parent molecules driving the unprecedented activity of comet C/2017 K2 can be investigated by analyzing its spectrum. In particular, the analysis of atomic oxygen emission lines and the calculation of the green (5577.339 Å) to red (6300.304 and 6363.776 Å) line intensity ratio (hereafter G/R) can reveal the nature of molecules driving cometary activity. We report on the detection of atomic oxygen lines in the spectra of comet C/2017 K2 (Pan-STARRS) from high-resolution spectra obtained at the Telescopio Nazionale Galileo (TNG) on 24 June and 2 July 2022 using the High Accuracy Radial velocity Planet Searcher North (HARPS-N) echelle spectrograph. We found G/R ratios equal to 0.29±0.02 (24 July 2022) and 0.27±0.01 (2 July 2022), which are consistent with a cometary activity driven by CO2, even if located at 2.8 au from the Sun. To better define the nature of the driving molecule, we measured the width of the three oxygen lines and found that the green line in the spectrum of 24 July 2022 is wider than either of the two red lines. This allows us to argue that CO2 is dissociated by highly energetic solar photons that produce O(1S) with a large excess velocity.
Key words: comets: general / comets: individual: C/2017 K2 / methods: observational / methods: data analysis
© The Authors 2023
 Open Access article, published by EDP Sciences, under the terms of the Creative Commons Attribution License (https://creativecommons.org/licenses/by/4.0), which permits unrestricted use, distribution, and reproduction in any medium, provided the original work is properly cited.
This article is published in open access under the Subscribe to Open model. This email address is being protected from spambots. You need JavaScript enabled to view it. to support open access publication.
1. Introduction
Comets are icy leftovers from the formation of our Solar System that are considered to be the most compositionally pristine objects to result from planetary accretion. Comets are grouped into two classes: short- and long-period comets. The former orbit the Sun in 200 years or less (Levison & Duncan 1994), while the long-period comets show periods greater than 200 years (Vokrouhlickỳ et al. 2019). Analyses of their orbits have suggested two major reservoirs for these objects: the Kuiper Belt (Kuiper 1951) and the Oort cloud (Oort 1950). The Kuiper belt is a region located beyond the orbit of the planet Neptune (at about 30 au) and contains pristine objects whose orbits lie close to the plane of the Solar System (Kuiper 1951). This region is considered to be the reservoir of most of the observed short-period comets. The Oort Cloud is a spherical cloud that may extend up to 50.000–100.000 au from the Sun and is believed to be the source of most of the observed long-period comets (Oort 1950). As a comet approaches the Sun, the rise in temperature causes its ices to sublimate. Water ice is considered as the most abundant cometary volatile responsible for the activity (Bockelée-Morvan et al. 2004) and for this reason, most known comets are active only when they are found inside the orbit of Jupiter. The interpretation of activity in distant comets is more complicated since more volatile ices than water (e.g., CO, CO2) may be involved (Jewitt 2009; Meech et al. 2017; Kulyk et al. 2016; Womack et al. 2017). The distant activity of comets observed traveling outbound from perihelion has been explained in terms of a slow propagation of heat acquired at perihelion and propagation into the nucleus interior (as in the case of comet 1P/Halley, Prialnik & Bar-Nun 1992). On the contrary, for inbound long-period comets approaching the inner part of the solar system from larger distance, the accumulation of heat is not an option. This is the case for the long-period comet C/2017 K2 (Pan-STARRS). On 21 May 2017, the Panoramic Survey Telescope and Rapid Response System (Pan-STARRS, Kaiser et al. 2002) was used to discover of the Oort Cloud C/2017 K2 comet at a heliocentric distance r = 16.1 au from the Sun. Observations of this inbound long-period comet revealed that C/2017 K2 was an active comet at a record heliocentric distance of 15.816 au (Jewitt 2009), and Hui et al. (2017) traced the C/2017 K2 activity back to May 2013 at an unprecedented heliocentric distance of 23.8 au. A photometric analysis of the coma reveal that activity began at heliocentric distance of ∼26 au (Jewitt et al. 2019), but a recent study indicates that comet C/2017 K2 was active at ∼35 au (Jewitt et al. 2021). Such an activity trend represents the largest distant at which an active comet has been observed approaching perihelion (Meech et al. 2009). Since activity at such distance cannot be driven by the sublimation or the exothermic crystallization of water ice, the activity of comet C/2017 K2 is consistent with activity driven by the sublimation of supervolatile ices such as CO (Yang et al. 2021), O2, CO2, and N2 (Jewitt et al. 2017). In particular, Yang et al. (2021) detected the J = 2 − 1 rotational transition of CO in comet C/2017 K2 when inbound at a heliocentric distance of 6.72 au. The corresponding carbon monoxide production rate is QCO = (1.6 ± 0.5)×1027 s−1. This CO production is probably supplied by surface sublimation of CO ice from about 1 km2 surface patch (Yang et al. 2021).
In this context, ground observations of comet C/2017 K2 offer the opportunity to monitor the activity of an Oort Cloud comet approaching the inner part of the solar system and to investigate such unusual cometary activity. In the following sections, we present the results of an observational study of C/2017 K2 at a heliocentric distance of ∼2.8 au carried out with the 360 cm Telescopio Nazionale Galileo (TNG). We focus on atomic oxygen emission lines to investigate the processes responsible for the production of these emissions and to define the nature of the parent source of [OI] by calculating the [OI] green to red-doublet emission ratio and measuring the intrinsic width of the different forbidden lines. The observed atomic green to red-doublet ratio is used as proxy to investigate the nature of the dominant source of these emission lines in comets since the direct measurement of molecules such as CO2 is only possible from space.
2. Atomic oxygen emission lines
The high-resolution spectra of comets can reveal the presence of three important emission lines of atomic oxygen: the green line at 5577.339 Å (1S−1D) and the forbidden red oxygen doublet at 6300.304 and 6363.776 Å (1D−3P) (Feldman et al. 2004). These emissions are due to the electronic transition of oxygen atoms from metastable 1S to 1D and from 1D to the ground 3P state, respectively. In cometary coma, the dissociative excitation of O-bearing neutrals by photoelectrons and photons, followed by a thermal recombination of atomic oxygen ions, are the sources of the O(1S) and O(1D) metastable states (Bhardwaj & Haider 2002; Bhardwaj & Raghuram 2011, 2012). Resonance fluorescence by solar photons is not an effective excitation mechanism for populating these metastable states due to optically forbidden transitions. In particular, the radiative decay of 1D to 3P leads to 6300 and 6364 Å emission lines. The 5% of oxygen atoms excited in the 1S state decay directly to the ground 3P state, yielding 2972 and 2958 Å emission lines. The remaining 95% that are produced in the 1S state decay to the ground 3P state via the 1D state emitting photons at 5577 Å wavelength. Knowledge of the oxygen intensity ratio can improve the understanding of the parent species which give rise to these transition. Atomic oxygen is mainly produced through the photo-dissociation of H2O, CO, CO2 (Festou & Feldman 1981), or even O2 (Cessateur et al. 2016), since other ices (e.g., H2CO) produce oxygen as part of subsequent decay of radicals and not as first product of photodissociation. The green-to-red intensity ratio (G/R) can be expressed as (Cochran & Cochran 2001):
 (1)
(1)
where τ is the dissociative lifetime of the parent molecule, α is the yield of photodissociation, β is the branching ratio, and N is the column density of the parent molecule. In Eq. (1), the assumption is that there is only one parent molecule and the parent column densities are almost the same (Capria et al. 2008). Thus, the column densities of the parent in the numerator and denominator in Eq. (1) are identical and the effective excitation rate for photodissociation of a parent molecule is proportional to τ−1αβ. Typical values of excitation rates are given in Table 2. Festou & Feldman (1981) have also provided branching ratios for the O(1S) and O(1D) metastable state of oxygen. In particular, the branching ratios of the O(1S) state are: undefined (5577 Å), 0.76 (6300 Å), and 0.24 (6364 Å). The branching ratios of the O(1D) state are: 0.95 (5577 Å), 0.72 (6300 Å), and 0.23 (6364 Å). Bockelée-Morvan et al. (2004) showed that comets around 1 au have H2O as the principal constituent in the cometary coma and, following Table 2Festou & Feldman (1981) proposed that if the parent source of [OI] prompt emissions is H2O in observed comets around 1 au, the green-to-red-doublet emission intensity ratio should be equal to 0.1. Conversely, the calculated green-to-red-doublet ratio of more than 0.1 is attributed to a higher relative abundances of CO2 and CO (Festou & Feldman 1981; Delsemme 1980).
3. Observations and data reduction
Two high-resolution spectra of comet C/2017 K2 were obtained on 24 June and 2 July 2022 using the High Accuracy Radial velocity Planet Searcher North (HARPS-N) echelle spectrograph (with the director’s discretionary time (DDT) program A45DDT3). In Table 1, we report the observing circumstances at the moment of observations. The spectrograph is fiber-fed by two fibers with an aperture of 1 arcsec each at the Nasmyth B focus of the 360 cm TNG, covering the wavelength range between 383 nm and 693 nm, and with a resolving power of R = δ/Δ(δ) = 115 000 (2.61 km s−1). The spectra were reduced in near real-time by using the HARPS-N Data Reduction Pipeline1, which implements the classical spectral extraction method from Horne (1986). The initial image processing of the extraction pipeline consists in the pixel-by-pixel subtraction of a bias image computed on the over-scan regions of the frame to eliminate the signal that is recorded by the detector in the absence of incoming light. The bias subtraction is followed by the spectrum extraction, flat fielding, and wavelength calibration. The extracted order spectra are then divided by the blaze function and the blaze-corrected individual orders are then combined into a single spectrum. To correct the 1D spectra we similarly reduced the HR7596 standard star spectrum and derived the instrumental response function. Spectra show telluric absorption lines at 6300 Å. Since this effect can lead to an underestimation of the [OI] line intensities, we removed the telluric absorption lines and subtracted the solar continuum contribution using the 16CygB solar analogue, degraded at the same spectral resolution of comet C/2017 K2. The solar analogue has been corrected for the comet’s Doppler shift and its radial velocity. Another contribution to the comet solar continuum is the background radiation by the Moon. In this case we consider such contribution negligible as the Moon was at 110° from the comet at the moment of observations. Both spectra have been corrected, taking into account the seeing effect (seeing: 0.9″ 24 June 2022, 1.1″ 2 July 2022). In order to use Eq. (1), we corrected the effect by collisional quenching on the measured [OI] line intensity. We estimated the ratio between the number of molecules given by a pure Haser density profile and by a Haser profile corrected for collisional quenching, according to the model of Bodewits et al. (2016). We investigated the trend of the correction factor using a H2O production rates from 1022 to 1030 s−1. In the case of comet C/2017 K2, we considered the maximum correction factor (1.5) associated with the maximum H2O production rate value (1030 s−1) to investigate the worst-case scenario. The adopted value of the correction factor allows us to conclude that the collisional quenching is not a significant loss process for [OI].
Observing parameters at the moment of observations.
4. Results
We analyzed two HARPS-N spectra of C/2017 K2 (Pan-STARRS) obtained on 24 June and 2 July 2022 and identified the emission of the forbidden green oxygen line at 5577.31 Å and the strong red doublet emission of [OI] at 6300.31 Å and at 6363.78 Å (see Fig. 1).
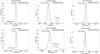 |
Fig. 1. C/2017 K2 (Pan-STARRS) forbidden oxygen emission lines in the spectra of 24 June and 2 July 2022. |
4.1. G/R ratio
To determine the main parent molecule of the oxygen atoms in comet C/2017 K2, we computed the green-to-red-doublet ratio for both calibrated spectra in which the three emission lines are clearly visible and separable from the telluric lines. The relative intensity of the green line in the spectrum of 24 June 2022 is 135.91, while the relative intensities of the red lines are 282.23 and 122.94, respectively. These values lead to a resulting G/R ratio of 0.29±0.02. The relative intensity of the green line in the spectrum of 2 July 2022 is 128.67, while the relative intensities of the red lines are 289.74 and 124.55, respectively (see Fig. 1). In this case, the resulting G/R ratio is equal to 0.27±0.01. The measured oxygen line ratios are corrected for collisional quenching. We estimated the ratio between the number of molecules given by a pure Haser density profile and by a Haser profile corrected for collisional quenching, according to the model of Bodewits et al. (2016). Using the value of Festou & Feldman (1981), we can conclude that both ratios are not consistent with water as the main parent of the oxygen. In fact, data taken at heliocentric distance < 2 au show that the G/R ratio average value equal to 0.09±0.02 (Decock et al. 2013) is in good agreement with the ratio for H2O as the parent molecule (Bhardwaj & Raghuram 2012; Festou & Feldman 1981). The higher values of the G/R in K2 can be explained by the increasing contribution at large heliocentric distances of other parent molecules producing oxygen atoms. Because of lower ice-sublimation temperatures, beyond 3 au (Crovisier & Encrenaz 2000), the cometary coma is dominantly composed of CO2 and/or CO.
4.2. Line widths
In addition to measuring the line intensities for the oxygen lines, we also measured the intrinsic width of the forbidden oxygen lines (based on the full width at half maximum, FWHM) by fitting a Gaussian profile using the IRAF2 software. The intrinsic FWHM is corrected for the instrumental width according to the equation  , using the FWHM of the Th–Ar wavelength calibration lines. The obtained intrinsic FWHMs are transformed into velocity (km s−1) using Eq. (2), that is:
 (2)
(2)
where λn corresponds to the wavelength of forbidden emission line. The measured and intrinsic widths are presented in Table 3. Error estimates for the measured FWHM are based on a Poisson statistics model of the data. In particular, the pixel value sigma is defined by  , where I is the pixel value, σ0 is the constant Gaussian sigma and represents the root mean square (rms) of the data values, and InvGain represents the noise near the continuum. The Gaussian fit error estimates is computed by Monte-Carlo simulation. One thousand simulations are created in which random Gaussian noise is added to the noise-free spectrum based on the pixel sigmas from the noise model. The model fitting is done for each simulation and the absolute deviation of each fitted parameter to model parameter is recorded. As expected, the two red line widths are equal within the errors since both lines are transitions from the O(1D) state to the ground state. In addition, the analysis shows that the [OI] cometary green line is broader than the [OI] red lines. This result is consistent with other observations made in other comets (Cochran 2008; Raghuram et al. 2020) and can be explained by the excess velocity of oxygen atoms acquired during the CO2 photodissociation.
5. Discussion and conclusions
Two high-resolution spectra of the Oort cloud comet C/2017 K2 (Pan-STARRS) were obtained on 24 June and 2 July 2022 by using the High Accuracy Radial velocity Planet Searcher North (HARPS-N) echelle spectrograph. The high resolution of the obtained spectra allowed to observe the three [OI] forbidden oxygen lines and measure the G/R = I5577/(I6300 + I6364). Our comparison of the obtained G/R ratios (0.29±0.02 and 0.27±0.01, respectively) with theoretical values (given in Table 2), we can confirm that H2O is not the main parent molecule photodissociating to produce oxygen atoms. At large heliocentric distances (> 2 au), the sublimation of water significantly decreases and comet activity is dominated by the sublimation of ices like CO and/or CO2 (Crovisier & Encrenaz 2000). Since K2 was located at heliocentric distance > 2.5 au, the best candidate for producing oxygen is CO2. To investigate the reliability of this result, we measured the FWHM(ν) of the lines. We found that the intrinsic green line width in the spectrum of 24 June 2022 is wider than the red ones (the green line width in the spectrum of 2 July 2022 cannot be accurately measured due to the large uncertainty, as shown in Table 3). This trend is mainly due to the photodissociation of CO2 that occurs in high-energy photons and results in O(1S) having a large excess mean velocity. By comparing the G/R ratio of C/2017 K2 with data from other comets analyzed by different authors and summarized in Decock et al. (2013), we noticed that K2 has a ratio that is much higher than other comets, with values around 0.1. Figure 18 in Decock et al. (2013) shows the G/R intensity ratio as a function of heliocentric distance for 18 comets. We modified the figure (see Fig. 2) including the G/R intensity ratios found for comet K2. Considering the data at heliocentric distance < 2 au, the average value of the G/R ratio is 0.09±0.02. The data at heliocentric distance > 2.5 au show a rapid increase in the G/R intensity ratio. The high value of G/R in Q4 could be explained by the increasing contribution of ices like CO and/or CO2 producing oxygen atoms. Decock et al. (2013) investigated the contribution of both ices in producing oxygen atoms in comets and, following Bhardwaj & Raghuram (2012), demonstrate that CO2 is the main contributor to the G/R ratio at the heliocentric distance limit of 2.5 au (Decock et al. 2013; Ootsubo et al. 2012), supporting what is found by the analysis of the forbidden oxygen lines in the spectra of comet K2.
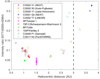 |
Fig. 2. G/R intensity ratio as a function of the heliocentric distance (AU). The same symbol is used for the different spectra of each comet. All points except C/2017 K2 (Pan-STARRS) are taken from Decock et al. (2013). The vertical line represents the distance out to which the sublimation of water is strongly decreasing (Crovisier & Encrenaz 2000). |
Excitation rates for dissociation (Bhardwaj & Raghuram 2012).
Observed relative intensity and line widths of forbidden atomic oxygen emissions in C/2017 K2.
IRAF is a tool for the reduction and the analysis of astronomical data (http://iraf.nao.ac.jp/).
Acknowledgments
Based on observations made with the Italian Telescopio Nazionale Galileo (TNG) operated on the island of La Palma by the Fundacion Galileo Galilei of the INAF (Istituto Nazionale di Astrofisica) at the Spanish Observatorio del Roque de los Muchachos of the Instituto de Astrofisica de Canarias. This research used the facilities of the Italian Center for Astronomical Archive (IA2) operated by INAF at the Astronomical Observatory of Trieste.
References
- Bhardwaj, A., & Haider, S. 2002, AdvSpR, 29, 745 [NASA ADS] [Google Scholar]
- Bhardwaj, A., & Raghuram, S. 2011, MNRASS, 412, L25 [NASA ADS] [CrossRef] [Google Scholar]
- Bhardwaj, A., & Raghuram, S. 2012, ApJ, 748, 13 [Google Scholar]
- Bockelée-Morvan, D., Crovisier, J., Mumma, M. J., & Weaver, H. A. 2004, Comets II, 1, 391 [Google Scholar]
- Bodewits, D., Lara, L. M., A’Hearn, M. F., et al. 2016, AJ, 152, 130 [NASA ADS] [CrossRef] [Google Scholar]
- Capria, M., Cremonese, G., Bhardwaj, A., De Sanctis, M., & Epifani, E. M. 2008, A&A, 479, 257 [NASA ADS] [CrossRef] [EDP Sciences] [Google Scholar]
- Cessateur, G., de Keyser, J., Maggiolo, R., et al. 2016, J. Geophys. Res. (Space Physics), 121, 804 [NASA ADS] [CrossRef] [Google Scholar]
- Cochran, A. L. 2008, Icarus, 198, 181 [NASA ADS] [CrossRef] [Google Scholar]
- Cochran, A. L., & Cochran, W. D. 2001, Icarus, 154, 381 [NASA ADS] [CrossRef] [Google Scholar]
- Crovisier, J., & Encrenaz, T. R. S. 2000, Comet Science: the Study of Remnants from the Birth of the Solar System (Cambridge: Cambridge University Press) [Google Scholar]
- Decock, A., Jehin, E., Hutsemekers, D., & Manfroid, J. 2013, A&A, 555, A34 [NASA ADS] [CrossRef] [EDP Sciences] [Google Scholar]
- Delsemme, P. 1980, Les spectres des molécules simples au laboratoire et en astrophysique: communications présentées au XXIe Colloque international d’astrophysique, tenu à Liège les 21, 22 et 23 juin 1977 (Université de Liège, Institut d’astrophysique) [Google Scholar]
- Feldman, P. D., Cochran, A. L., & Combi, M. R. 2004, Comets, II, 425 [Google Scholar]
- Festou, M., & Feldman, P. 1981, A&A, 103, 154 [NASA ADS] [Google Scholar]
- Horne, K. 1986, PASP, 98, 609 [Google Scholar]
- Hui, M.-T., Jewitt, D., & Clark, D. 2017, AJ, 155, 25 [CrossRef] [Google Scholar]
- Jewitt, D. 2009, AJ, 137, 4296 [Google Scholar]
- Jewitt, D., Hui, M.-T., Mutchler, M., et al. 2017, ApJ, 847, L19 [Google Scholar]
- Jewitt, D., Agarwal, J., Hui, M.-T., et al. 2019, ApJ, 157, 65 [CrossRef] [Google Scholar]
- Jewitt, D., Kim, Y., Mutchler, M., et al. 2021, AJ, 161, 188 [NASA ADS] [CrossRef] [Google Scholar]
- Kaiser, N., Aussel, H., Burke, B. E., et al. 2002, Survey and Other Telescope Technologies and Discoveries, SPIE, 4836, 154 [Google Scholar]
- Kuiper, G. 1951, in On the Origin of the Solar System, ed. J. A. Hynek (New York: McGraw-Hill), Astrophysics: A Topical Symposium, 357 [Google Scholar]
- Kulyk, I., Korsun, P., Rousselot, P., Afanasiev, V., & Ivanova, O. 2016, Icarus, 271, 314 [Google Scholar]
- Levison, H. F., & Duncan, M. J. 1994, Icarus, 108, 18 [NASA ADS] [CrossRef] [Google Scholar]
- Meech, K. J., Kleyna, J. T., Hainaut, O., et al. 2017, ApJ, 849, L8 [NASA ADS] [CrossRef] [Google Scholar]
- Meech, K. J., Pittichová, J., Bar-Nun, A., et al. 2009, Icarus, 201, 719 [NASA ADS] [CrossRef] [Google Scholar]
- Oort, J. H. 1950, Bull. Astron. Inst. Neth., 11, 91 [Google Scholar]
- Ootsubo, T., Kawakita, H., Hamada, S., et al. 2012, ApJ, 752, 15 [Google Scholar]
- Prialnik, D., & Bar-Nun, A. 1992, A&A, 258, L9 [NASA ADS] [Google Scholar]
- Raghuram, S., Hutsemekers, D., Opitom, C., et al. 2020, A&A, 635, A108 [NASA ADS] [CrossRef] [EDP Sciences] [Google Scholar]
- Vokrouhlickỳ, D., Nesvornỳ, D., & Dones, L. 2019, AJ, 157, 181 [CrossRef] [Google Scholar]
- Womack, M., Sarid, G., & Wierzchos, K. 2017, PASP, 129, 031001 [Google Scholar]
- Yang, B., Jewitt, D., Zhao, Y., et al. 2021, ApJ, 914, L17 [NASA ADS] [CrossRef] [Google Scholar]
All Tables
Observed relative intensity and line widths of forbidden atomic oxygen emissions in C/2017 K2.
All Figures
|
Fig. 1. C/2017 K2 (Pan-STARRS) forbidden oxygen emission lines in the spectra of 24 June and 2 July 2022. |
| In the text | |
|
Fig. 2. G/R intensity ratio as a function of the heliocentric distance (AU). The same symbol is used for the different spectra of each comet. All points except C/2017 K2 (Pan-STARRS) are taken from Decock et al. (2013). The vertical line represents the distance out to which the sublimation of water is strongly decreasing (Crovisier & Encrenaz 2000). |
| In the text | |
Current usage metrics show cumulative count of Article Views (full-text article views including HTML views, PDF and ePub downloads, according to the available data) and Abstracts Views on Vision4Press platform.
Data correspond to usage on the plateform after 2015. The current usage metrics is available 48-96 hours after online publication and is updated daily on week days.
Initial download of the metrics may take a while.