Fig. 11.
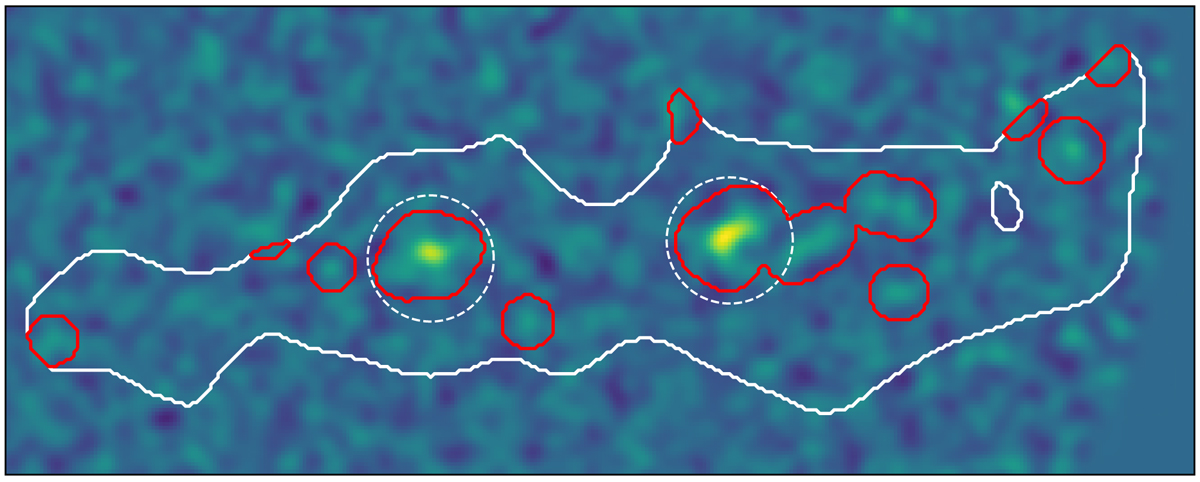
Medium frequency narrowband image of the main group 2 filament (rotated by 90° counterclockwise). The compact source segmentation contours are shown in red. The two white dashed circles display the 3.5″ radius area (27 pkpc) where the diffuse emission from the CGM of the two LAEs (bright yellow clumps) identified in the catalog becomes insignificant.
Current usage metrics show cumulative count of Article Views (full-text article views including HTML views, PDF and ePub downloads, according to the available data) and Abstracts Views on Vision4Press platform.
Data correspond to usage on the plateform after 2015. The current usage metrics is available 48-96 hours after online publication and is updated daily on week days.
Initial download of the metrics may take a while.