Fig. 6.
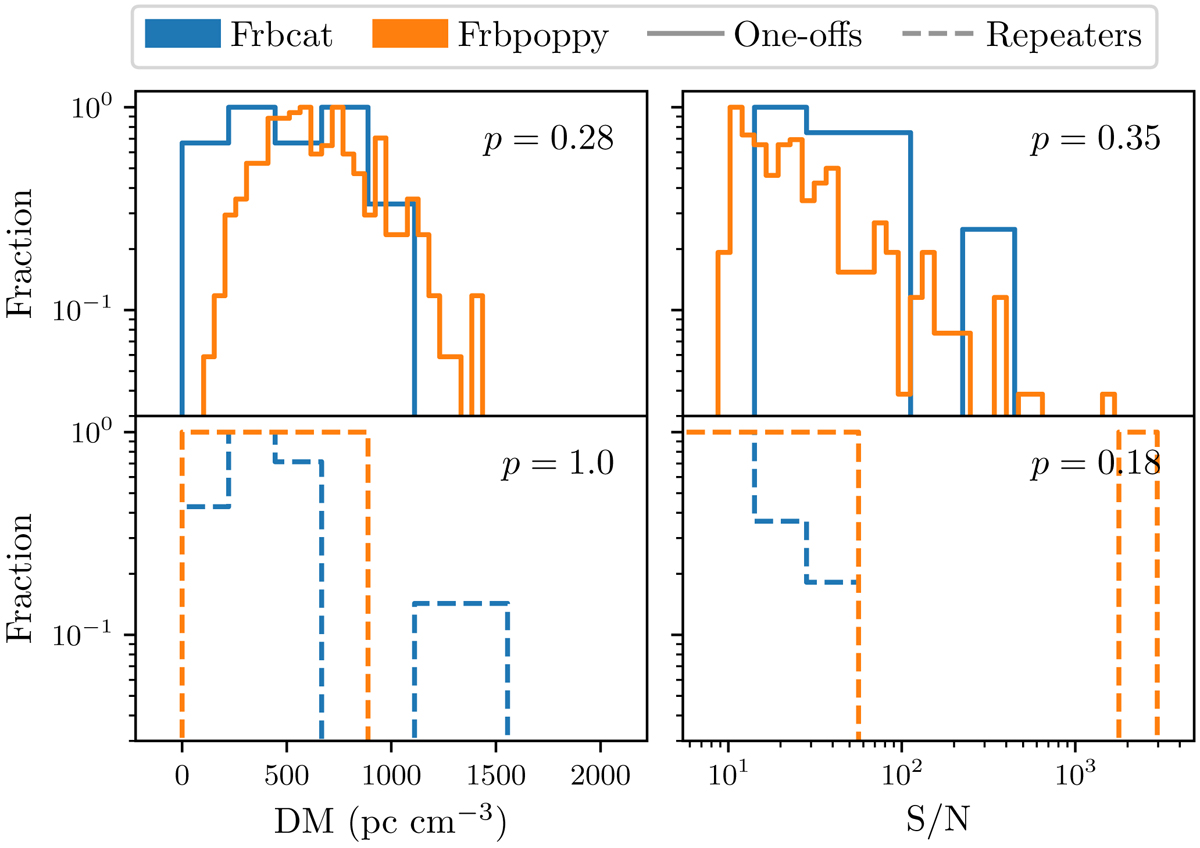
Left column: real (blue) and simulated (orange) observed CHIME/FRB dispersion measure (DM) distributions for seemingly one-off sources (solid) and observed repeating sources (dashed). Right column: same groups, but showing the observed S/N distributions instead. In both cases, distributions were normalised to their maximum value to allow for comparison. Each panel shows the p-values from a KS-test conducted between both shown distributions.
Current usage metrics show cumulative count of Article Views (full-text article views including HTML views, PDF and ePub downloads, according to the available data) and Abstracts Views on Vision4Press platform.
Data correspond to usage on the plateform after 2015. The current usage metrics is available 48-96 hours after online publication and is updated daily on week days.
Initial download of the metrics may take a while.