Fig. 4.
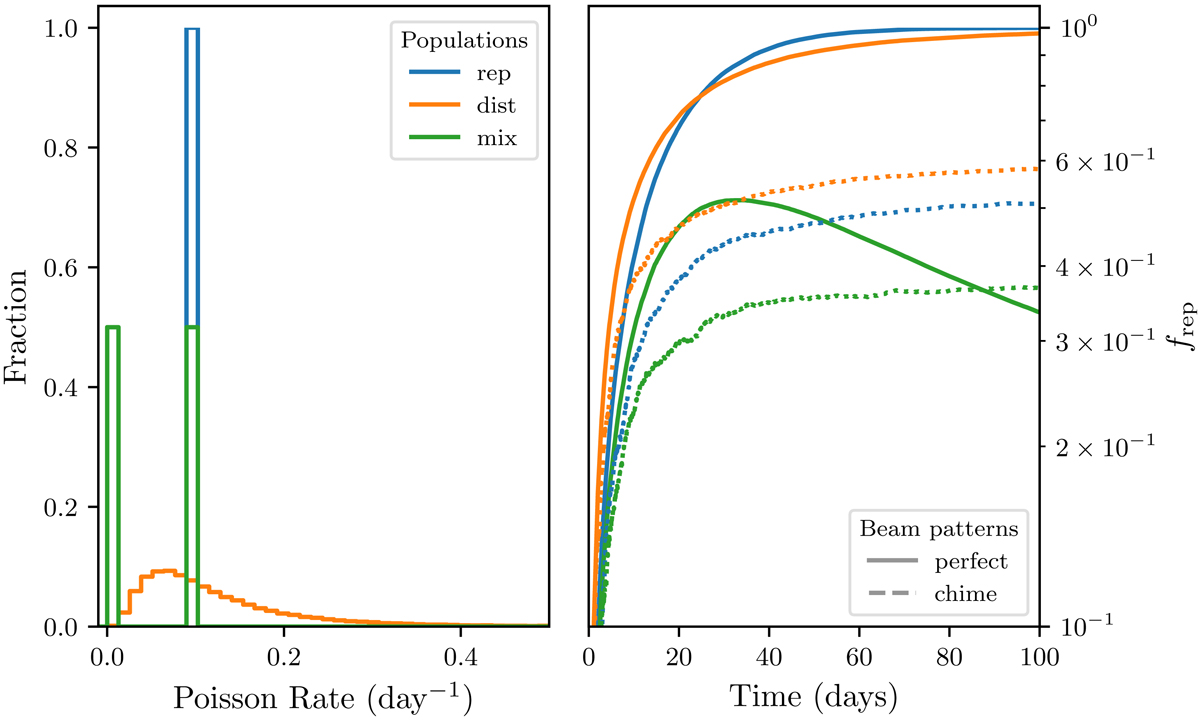
Left: distributions of Poisson burst rate for various simulated intrinsic populations, including a single value (blue), a log-normal distribution (orange), and a mix of single values and one-offs (green). Right: repeater fraction frep, defined as the number of detected repeating sources over the total number of detected sources against time. The various line styles represent the detections from a perfect survey with an S/N cut-off with either a perfect beam pattern (solid), or a CHIME-like beam pattern (dotted).
Current usage metrics show cumulative count of Article Views (full-text article views including HTML views, PDF and ePub downloads, according to the available data) and Abstracts Views on Vision4Press platform.
Data correspond to usage on the plateform after 2015. The current usage metrics is available 48-96 hours after online publication and is updated daily on week days.
Initial download of the metrics may take a while.