Fig. 3.
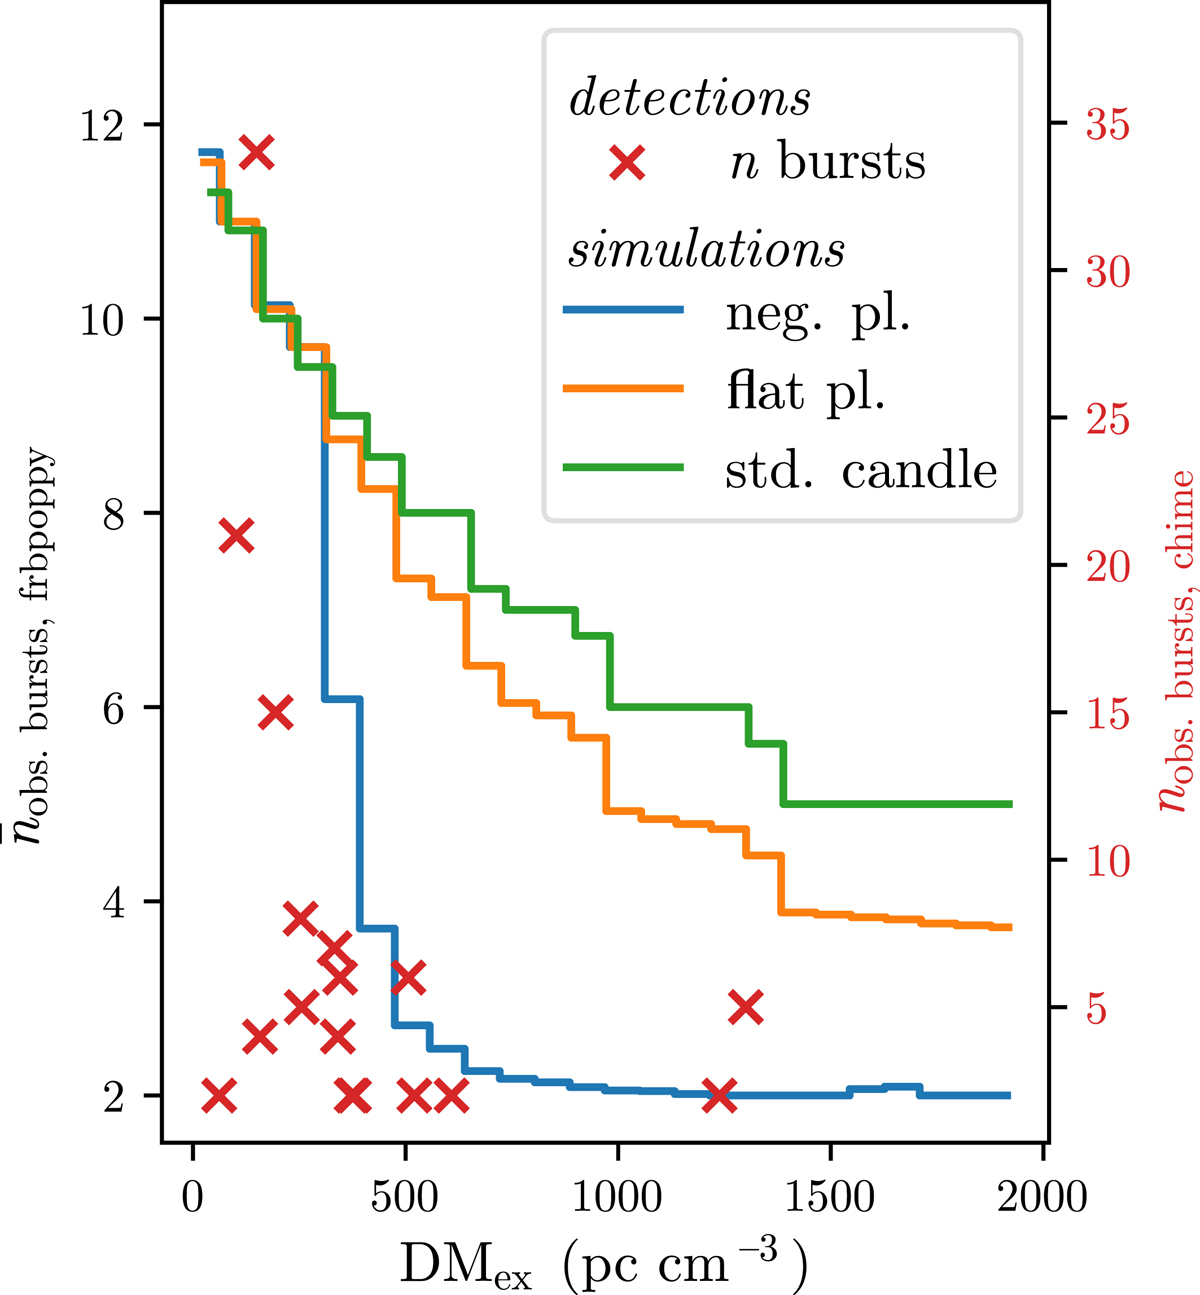
Observed (crosses) and simulated (lines) number of observed bursts per repeater source, as a function of extragalactic dispersion measure. The red crosses show the observed burst rates from CHIME repeaters (scale on the right axis). The lines show the simulated average observed burst rates (scale on the left axis) for various luminosity functions along the same extragalactic dispersion measure axis.
Current usage metrics show cumulative count of Article Views (full-text article views including HTML views, PDF and ePub downloads, according to the available data) and Abstracts Views on Vision4Press platform.
Data correspond to usage on the plateform after 2015. The current usage metrics is available 48-96 hours after online publication and is updated daily on week days.
Initial download of the metrics may take a while.