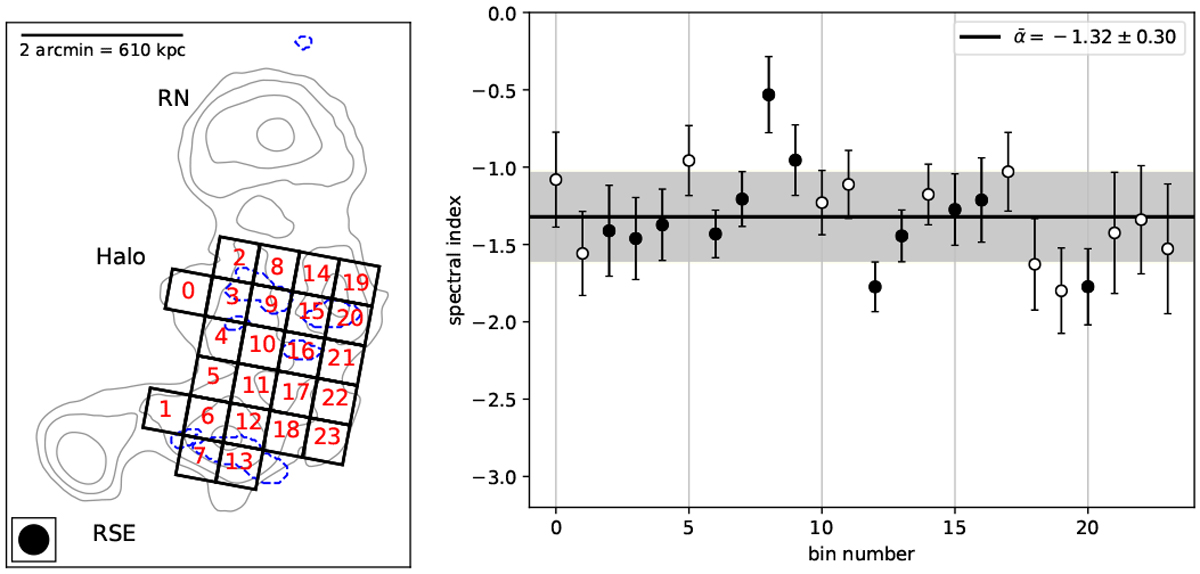
Fig. 9

Left: regions with bin numbers in the cluster system eFEDS J093513.3+004746 and eFEDS J093510.7+004910 where spectral indices are extracted. The size of the square regions is 30 arcsec. Right: spectral indices in the halo region. The horizontal line and the gray region are the mean and 1σ error for allthe data points, respectively. The filled points are the spectral indices in the regions where the compact sources are subtracted (i.e., inside blue dashed contours in the left image).
Current usage metrics show cumulative count of Article Views (full-text article views including HTML views, PDF and ePub downloads, according to the available data) and Abstracts Views on Vision4Press platform.
Data correspond to usage on the plateform after 2015. The current usage metrics is available 48-96 hours after online publication and is updated daily on week days.
Initial download of the metrics may take a while.


