Fig. 5
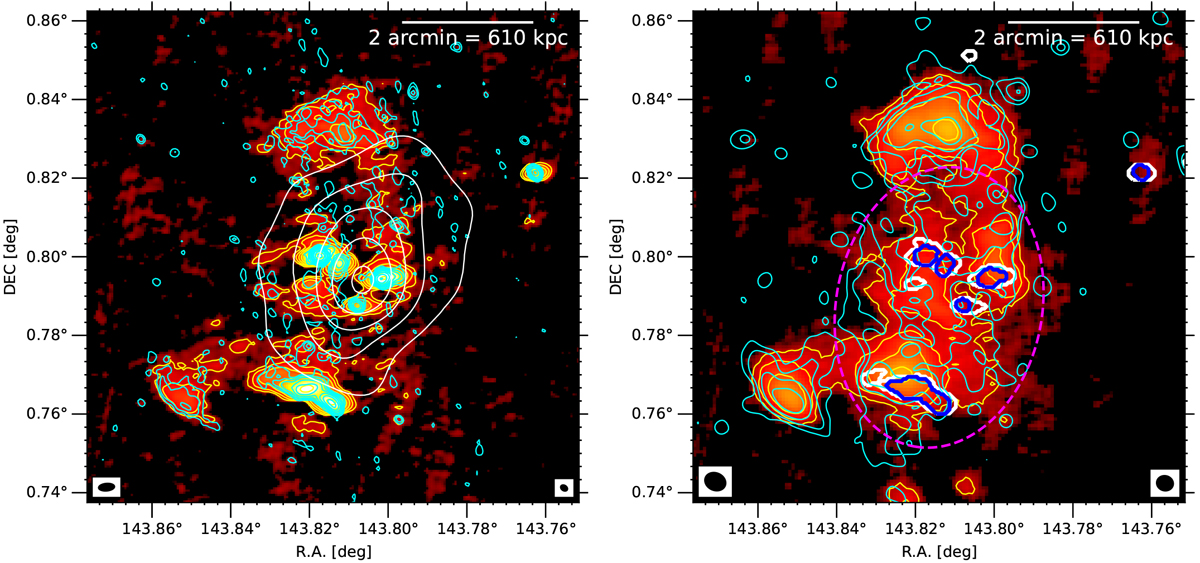
Left: LOFAR 145 MHz high-resolution image (7.5 arcmin × 7.5 arcmin) of the cluster system eFEDS J093513.3+004746 and eFEDS J093510.7+004910. The LOFAR (yellow) and uGMRT (cyan) contours are drawn at levels of [1, 2, 4, 8, 16, 32, 64] × 3σ where σLOFAR = 265 μJy beam−1 and σuGMRT = 45 μJy beam−1. The resolution is 14.7 arcsec × 7.0 arcsec with a position angle of −85 degree and 6.9 arcsec × 5.1 arcsec (PA = 57 degree) for the LOFAR and uGMRT images, respectively. The X-ray eROSITA (white) contours are at the levels of [0.2, 0.36, 0.52, 0.68, 0.84, 1] cts s−1 arcmin−2. Right: LOFAR 145 MHz and uGMRT 383 MHz low-resolution contour image after the subtraction of pointsources which are shown with the white and blue lines, respectively. The LOFAR (yellow) and uGMRT (cyan) contour levels are identical to those in the left image with σLOFAR = 340 μJy beam−1 and σuGMRT = 70 μJy beam−1. Here beam_LOFAR = 19.8 arcsec × 16.2 arcsec (PA = 66 degree) and beam_uGMRT = 15.5 arcsec × 13.9 arcsec (PA = 75 degree). The (magenta dashed) ellipse shows the region where the integrated flux density for radio halo is measured. In both images, the LOFAR and uGMRT synthesized beams are shown in the bottom left and right corners, respectively.
Current usage metrics show cumulative count of Article Views (full-text article views including HTML views, PDF and ePub downloads, according to the available data) and Abstracts Views on Vision4Press platform.
Data correspond to usage on the plateform after 2015. The current usage metrics is available 48-96 hours after online publication and is updated daily on week days.
Initial download of the metrics may take a while.