Fig. 10
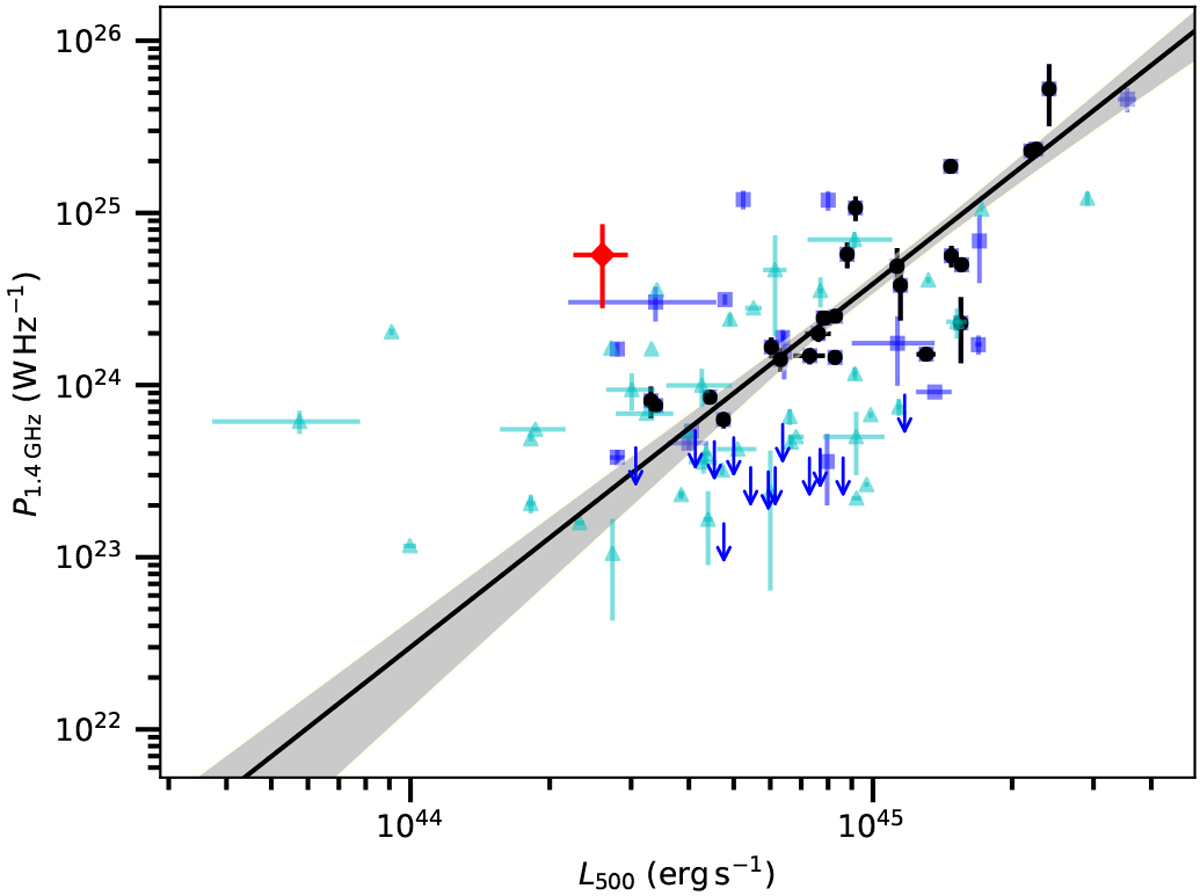
P1.4 GHz − L500 scaling relation adapted from Bîrzan et al. (2019) with the data point for the cluster system eFEDS J093513.3+004746 and eFEDS J093510.7+004910 in red. The halo samples are taken from Cassano et al. (2013, black circles), Martinez Aviles et al. (2016, blue squares), and Bîrzan et al. (2019, cyan triangles). The upper limits for undetected radio halos are shown with the blue arrows (Cassano et al. 2013; Kale et al. 2015). The best-fit relation and the 95% confidence region derived in Cassano et al. (2013) are also plotted.
Current usage metrics show cumulative count of Article Views (full-text article views including HTML views, PDF and ePub downloads, according to the available data) and Abstracts Views on Vision4Press platform.
Data correspond to usage on the plateform after 2015. The current usage metrics is available 48-96 hours after online publication and is updated daily on week days.
Initial download of the metrics may take a while.