Fig. 4.
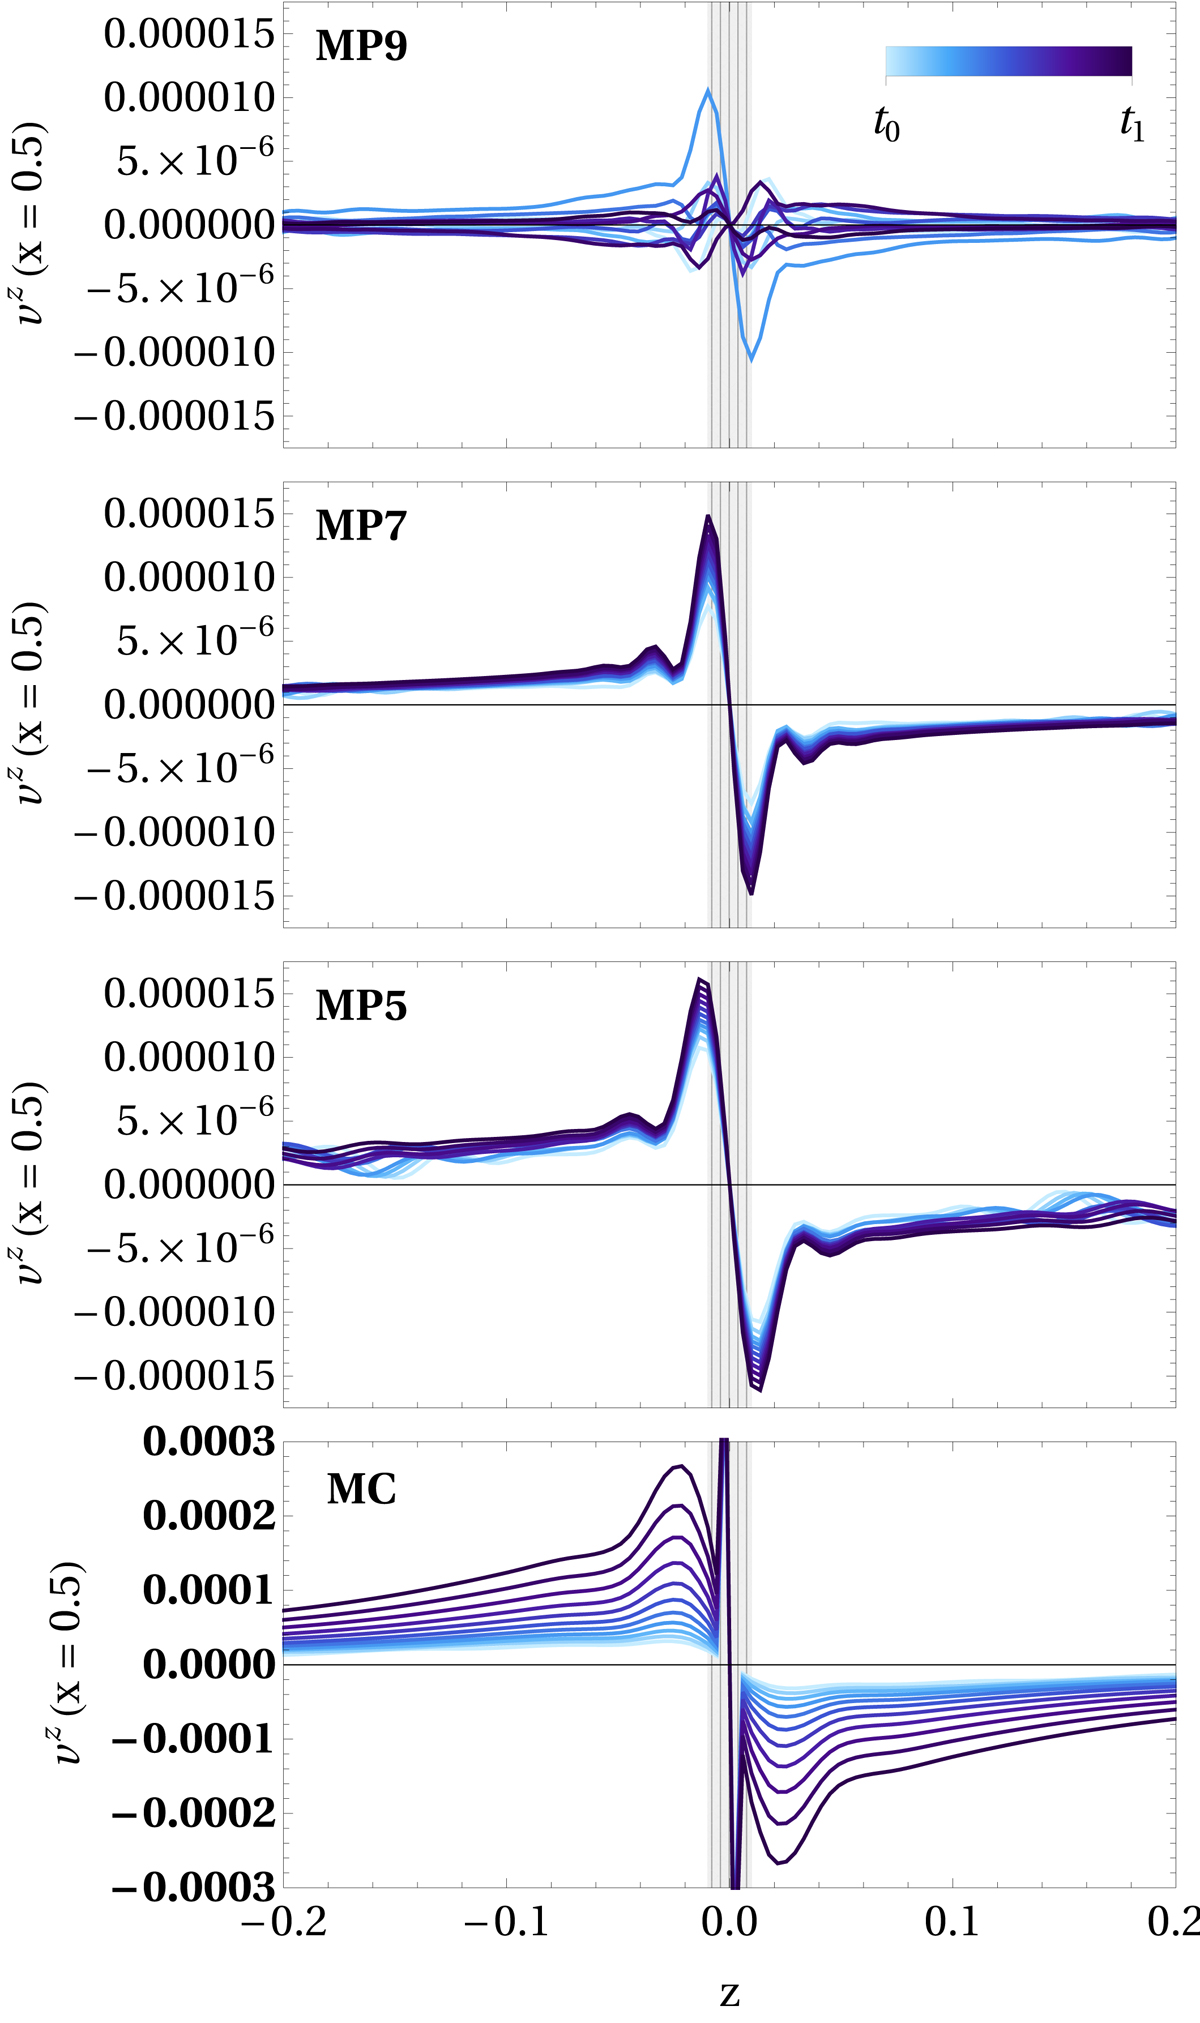
Evolution of the drift velocity Vz along the mid-point of the current sheet (x = 0.5) in the direction transverse to the current sheet (z-direction) during the linear phase (time-interval [t0,t1] for which the growth rate is derived in Fig. 3). The different panels correspond to different reconstruction schemes (see legends) and a resolution of p = 25.6 numerical zones per transverse size of the current sheet. The assumed width of the resistive layer LR employed for the analysis in Sect. 2.2 is indicated by the vertical gray lines in the background; each of these lines denotes the limits of the computational zones in the z-direction. The growth of the velocity component Vz is strongly suppressed for higher-order (MP) reconstruction methods and is significantly larger when using the MC reconstruction (we note the different scale for the lower panel).
Current usage metrics show cumulative count of Article Views (full-text article views including HTML views, PDF and ePub downloads, according to the available data) and Abstracts Views on Vision4Press platform.
Data correspond to usage on the plateform after 2015. The current usage metrics is available 48-96 hours after online publication and is updated daily on week days.
Initial download of the metrics may take a while.