Fig. 5.
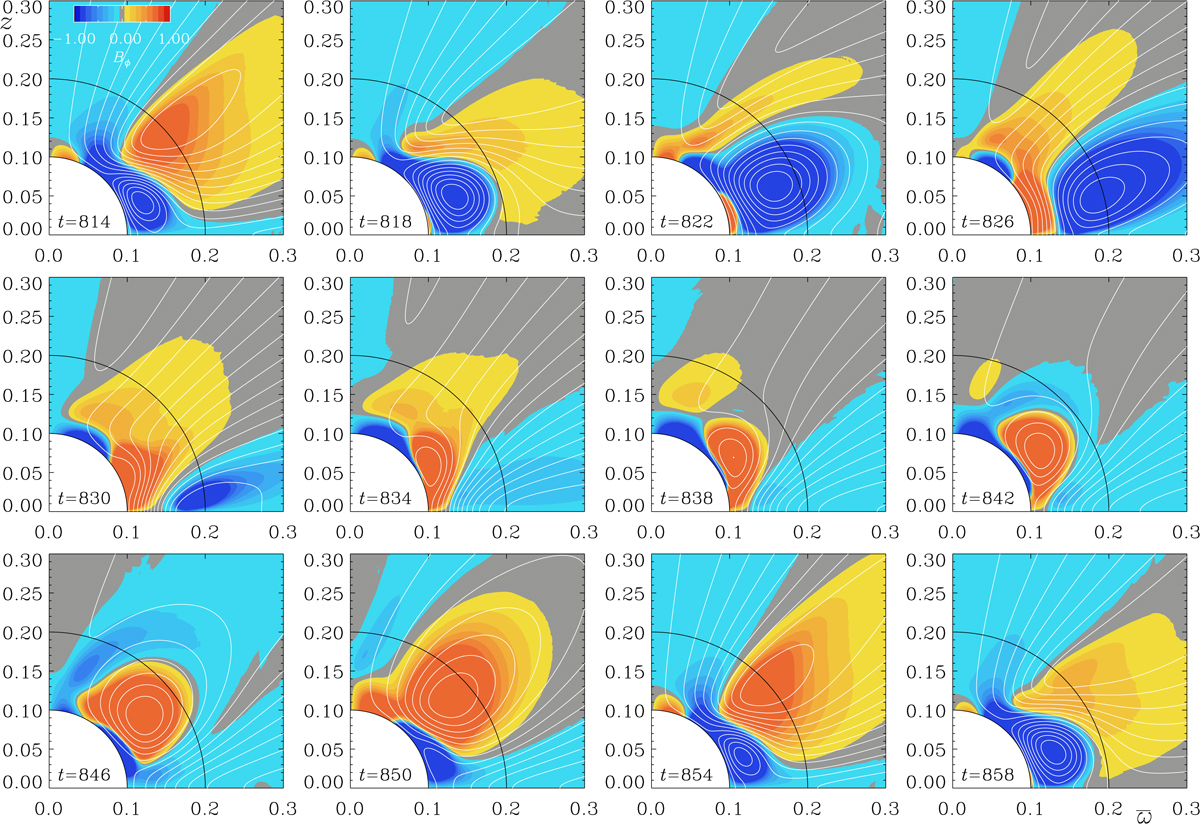
Similar to Fig. 3, but this time with a color representation of Bϕ(r, θ) showing only the region close to the center. Note the occurrence of V-shaped field lines during certain times at 822 ≤ t ≤ 834, and 846. The field shows radial outward migration during certain times: negative Bϕ at low latitudes for 814 ≤ t ≤ 826, and positive Bϕ at midlatitudes for 834 ≤ t ≤ 854.
Current usage metrics show cumulative count of Article Views (full-text article views including HTML views, PDF and ePub downloads, according to the available data) and Abstracts Views on Vision4Press platform.
Data correspond to usage on the plateform after 2015. The current usage metrics is available 48-96 hours after online publication and is updated daily on week days.
Initial download of the metrics may take a while.