Free Access
Fig. 12.
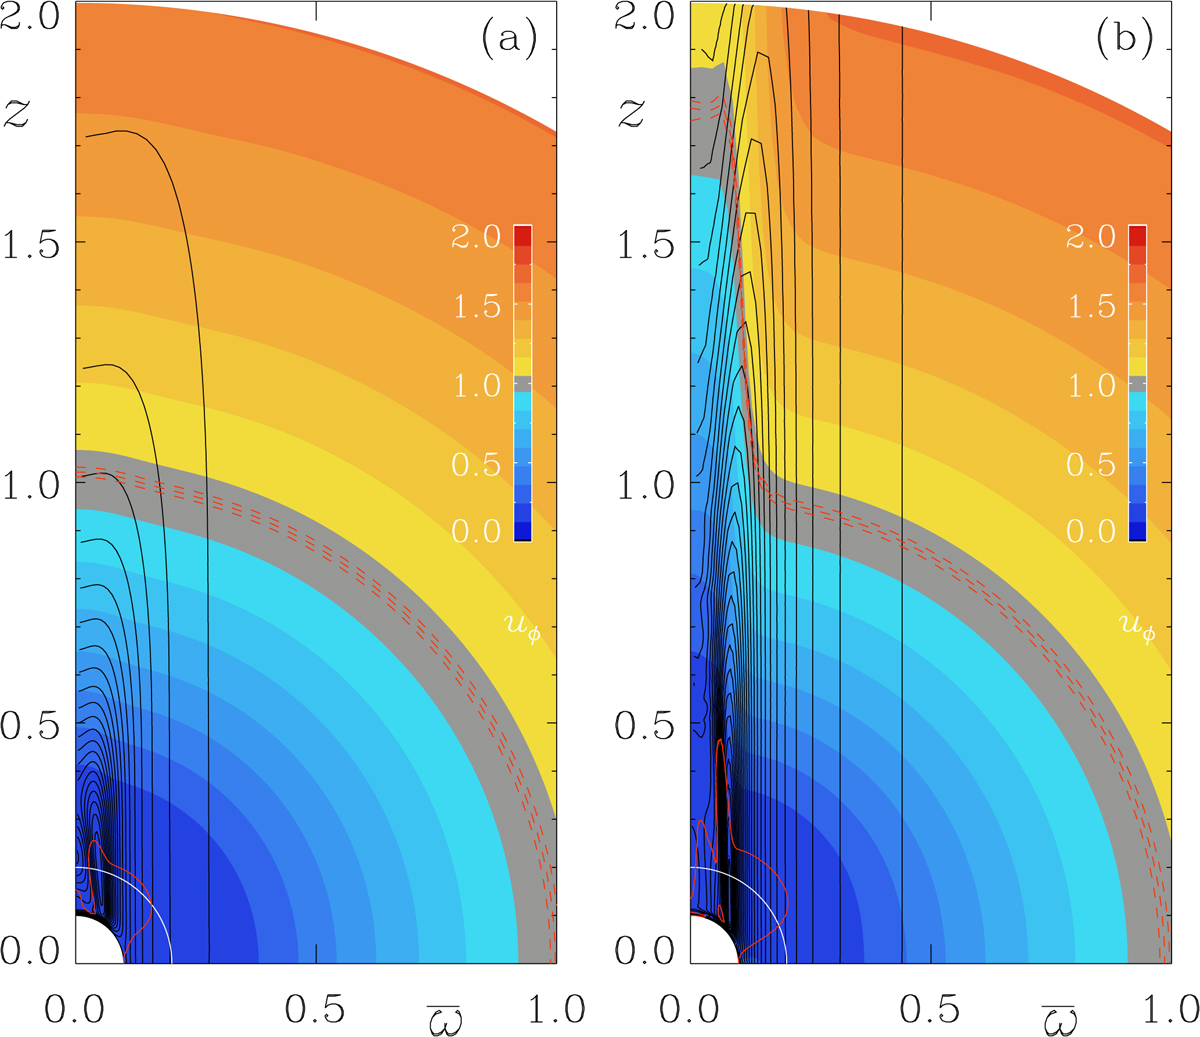
Angular velocity contours superimposed on a color representation of ![]() for Model B (a) with
for Model B (a) with ![]() and Model C (b) with
and Model C (b) with ![]() . The nearly concentric red solid lines show the surfaces where
. The nearly concentric red solid lines show the surfaces where ![]() is transalfvénic and the red dashed ones show the surfaces where it is transmagnetosonic.
is transalfvénic and the red dashed ones show the surfaces where it is transmagnetosonic.
Current usage metrics show cumulative count of Article Views (full-text article views including HTML views, PDF and ePub downloads, according to the available data) and Abstracts Views on Vision4Press platform.
Data correspond to usage on the plateform after 2015. The current usage metrics is available 48-96 hours after online publication and is updated daily on week days.
Initial download of the metrics may take a while.