Fig. 10.
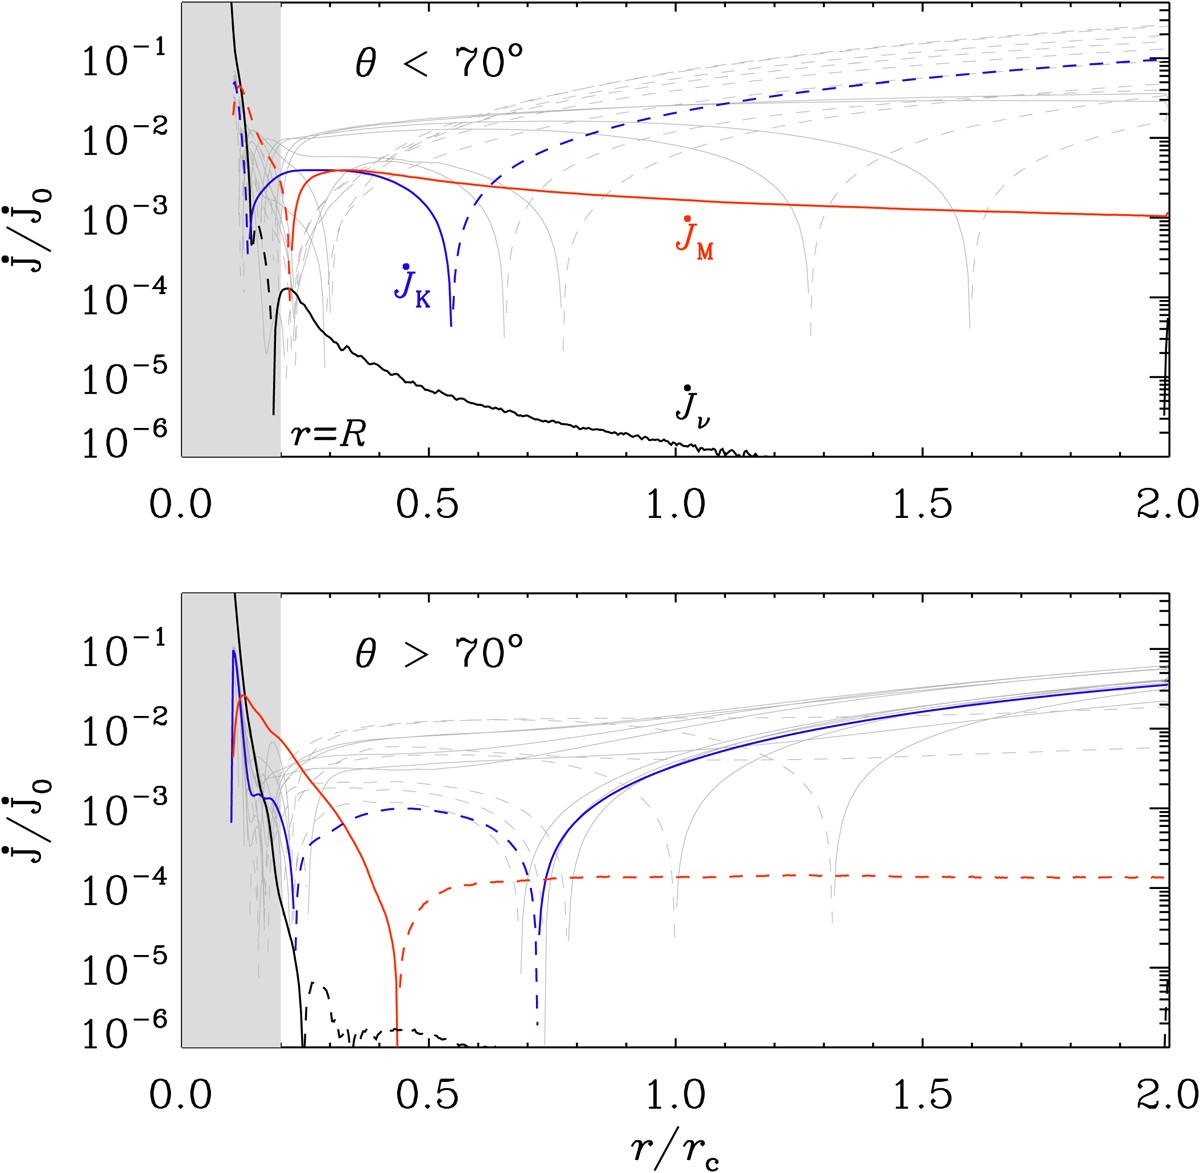
Time averaged radial profiles of latitudinally averaged ![]() for θ < 70° (upper panel) and θ > 70° (lower panel). The blue (red) lines refer to kinetic (magnetic) contributions, and the black lines denote the turbulent viscous contribution. Positive (negative) values are shown as solid (dotted) lines. The kinetic contributions from different times are shown as gray lines. The gray background on the left indicates the location of the stellar envelope.
for θ < 70° (upper panel) and θ > 70° (lower panel). The blue (red) lines refer to kinetic (magnetic) contributions, and the black lines denote the turbulent viscous contribution. Positive (negative) values are shown as solid (dotted) lines. The kinetic contributions from different times are shown as gray lines. The gray background on the left indicates the location of the stellar envelope.
Current usage metrics show cumulative count of Article Views (full-text article views including HTML views, PDF and ePub downloads, according to the available data) and Abstracts Views on Vision4Press platform.
Data correspond to usage on the plateform after 2015. The current usage metrics is available 48-96 hours after online publication and is updated daily on week days.
Initial download of the metrics may take a while.