Fig. 9.
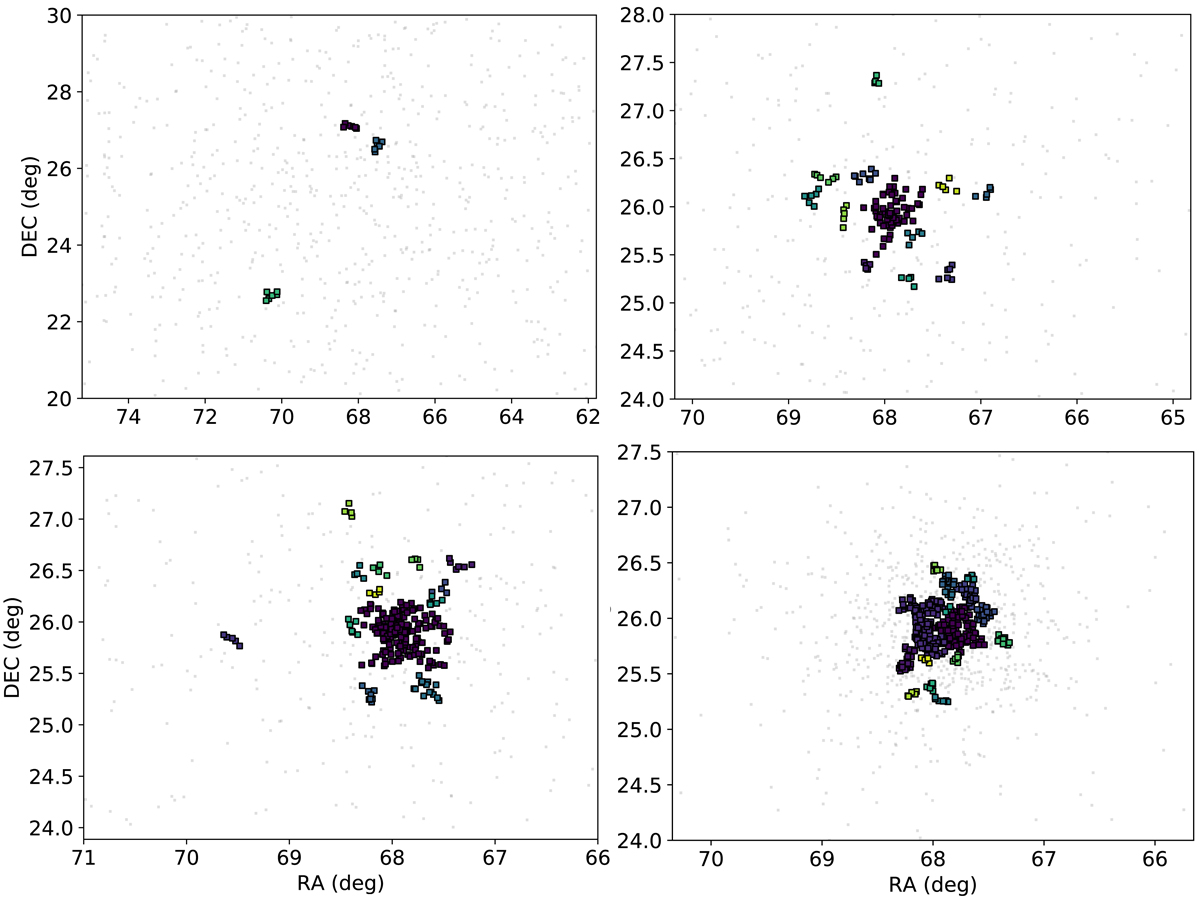
Maps with the structures found using the procedure, e.g., simulations drawn from concentrated distributions. From left to right and top to bottom: radial with exponent E = 1.0, radial with E = 2.0, radial with E = 2.5, and Plummer, respectively. Noise stars are represented as grey dots, while the stars belonging to substructures are squares coloured in different shades of blue, purple, green, and yellow according to the small scale structure that they belong to. We note that only the central area of the clusters is shown, so the retrieved substructure is clearer.
Current usage metrics show cumulative count of Article Views (full-text article views including HTML views, PDF and ePub downloads, according to the available data) and Abstracts Views on Vision4Press platform.
Data correspond to usage on the plateform after 2015. The current usage metrics is available 48-96 hours after online publication and is updated daily on week days.
Initial download of the metrics may take a while.