Fig. 4.
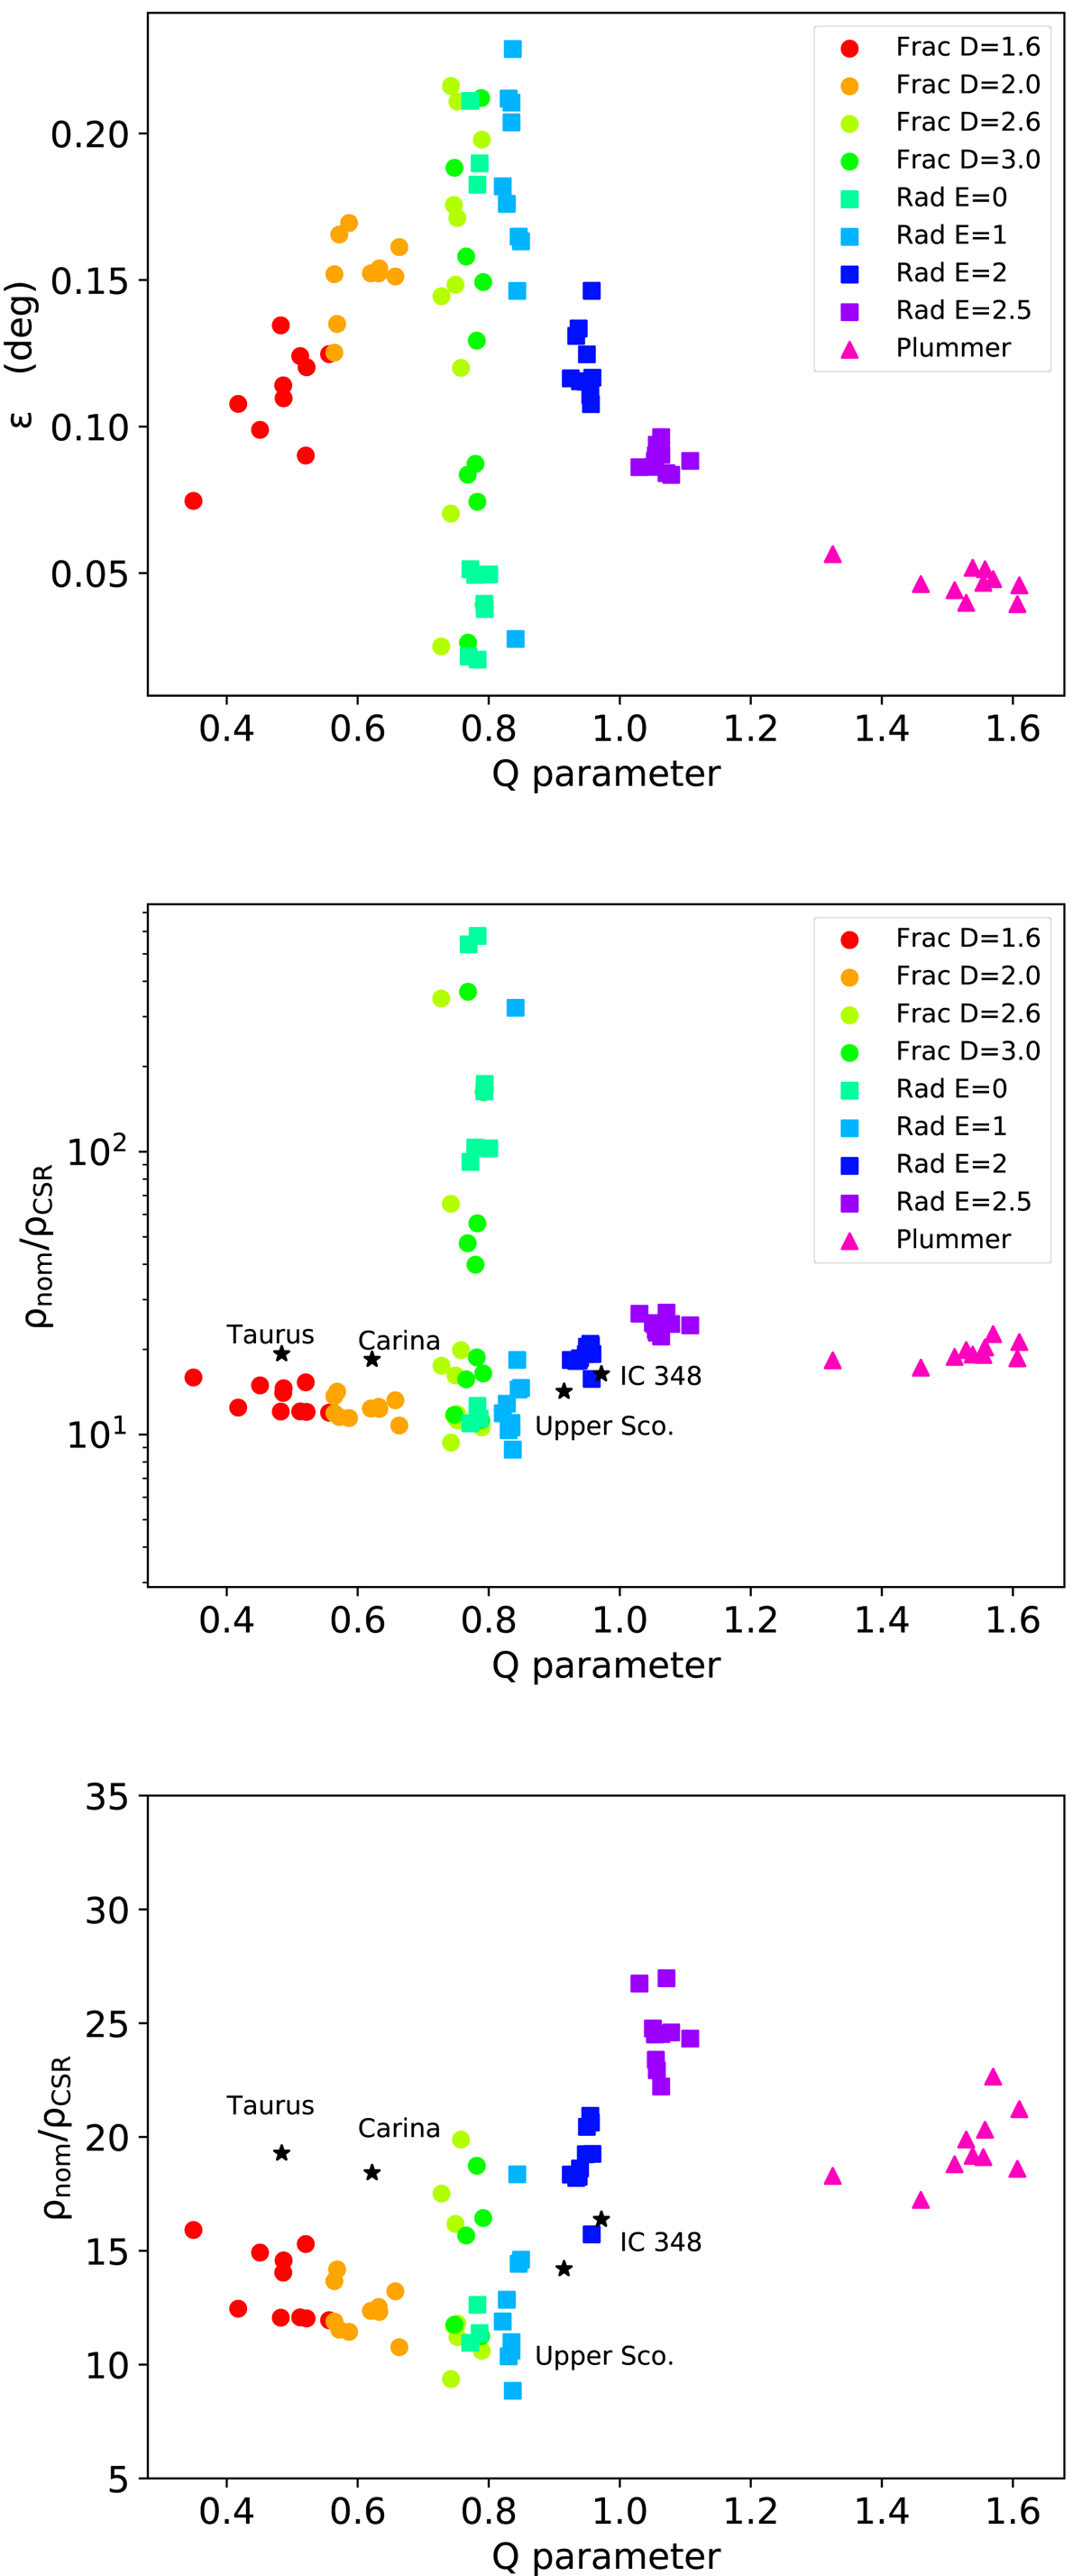
Top: ϵ scale parameter for DBSCAN calculated with the procedure presented in Sect. 2.2 against Q structure parameter. Middle: relative nominal density of the detected structures (![]() , as described in the text) against Q structure parameter. Colours and symbols represent parent distributions, with the same code as in Fig. 3. Bottom: same plot as in the middle panel, linearly scaled and zoomed, so that the general trends are clearer.
, as described in the text) against Q structure parameter. Colours and symbols represent parent distributions, with the same code as in Fig. 3. Bottom: same plot as in the middle panel, linearly scaled and zoomed, so that the general trends are clearer.
Current usage metrics show cumulative count of Article Views (full-text article views including HTML views, PDF and ePub downloads, according to the available data) and Abstracts Views on Vision4Press platform.
Data correspond to usage on the plateform after 2015. The current usage metrics is available 48-96 hours after online publication and is updated daily on week days.
Initial download of the metrics may take a while.