Fig. C.2.
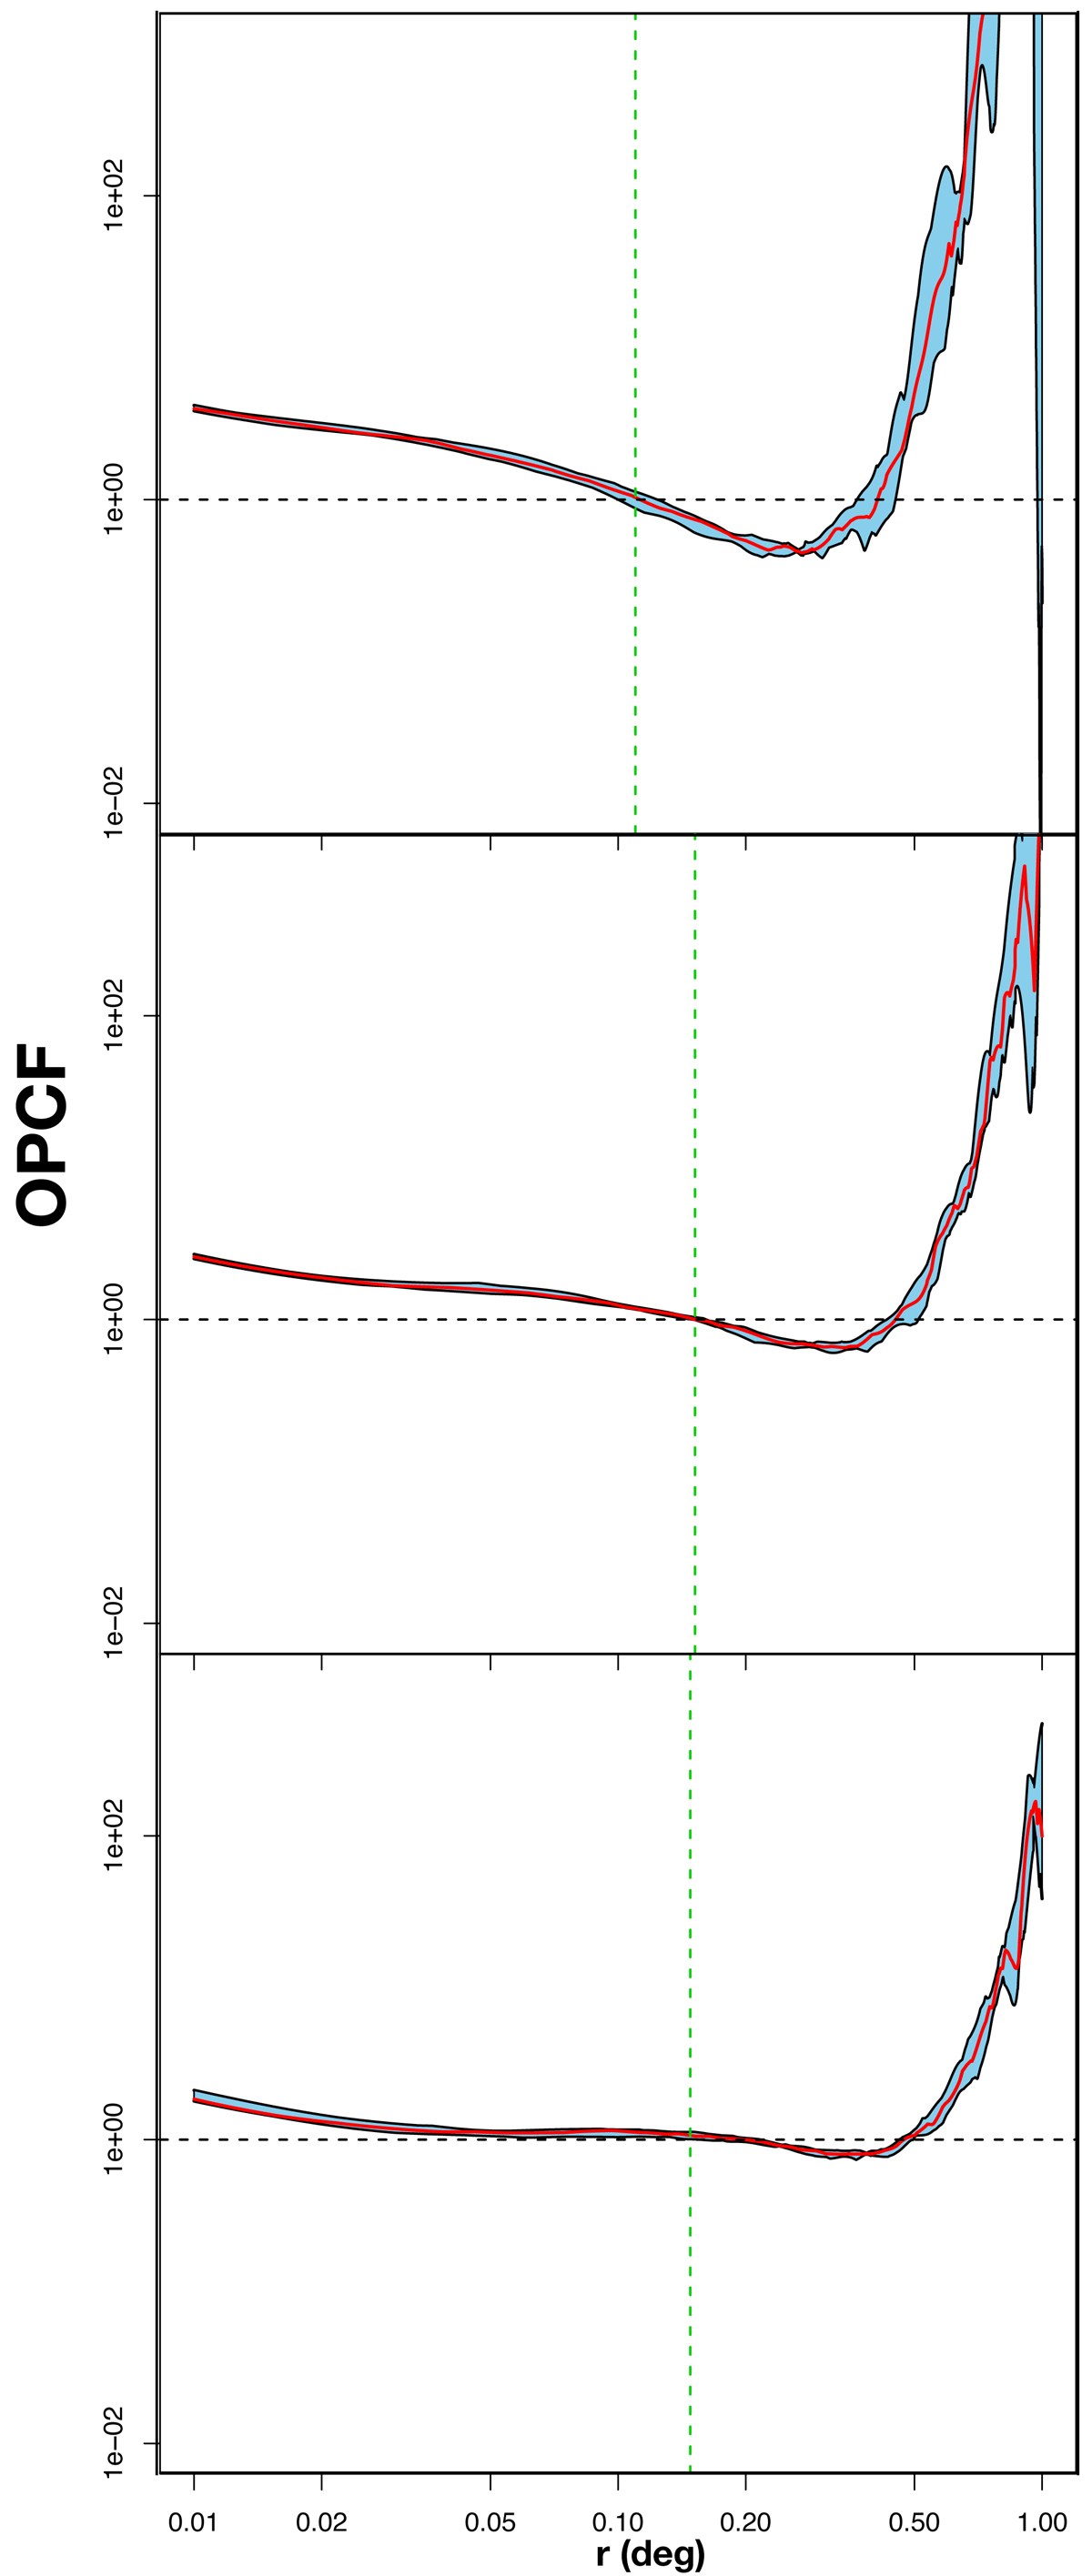
Top: median value of the OPCF at each distance for 10 realisations of a fractal distribution with D = 1.6 in red. Black solid lines represent the quartiles Q1 and Q3, with the inter-quartile range area shaded in blue. The horizontal dashed black line at constant value 1 represents the theoretical value for CSR, and the vertical dashed green line shows the average value of the ϵ obtained by S2D2 (see Table 2). Middle: same for a fractal distribution with D = 2.0. Bottom: same for a fractal distribution with D = 2.6.
Current usage metrics show cumulative count of Article Views (full-text article views including HTML views, PDF and ePub downloads, according to the available data) and Abstracts Views on Vision4Press platform.
Data correspond to usage on the plateform after 2015. The current usage metrics is available 48-96 hours after online publication and is updated daily on week days.
Initial download of the metrics may take a while.