Fig. B.2.
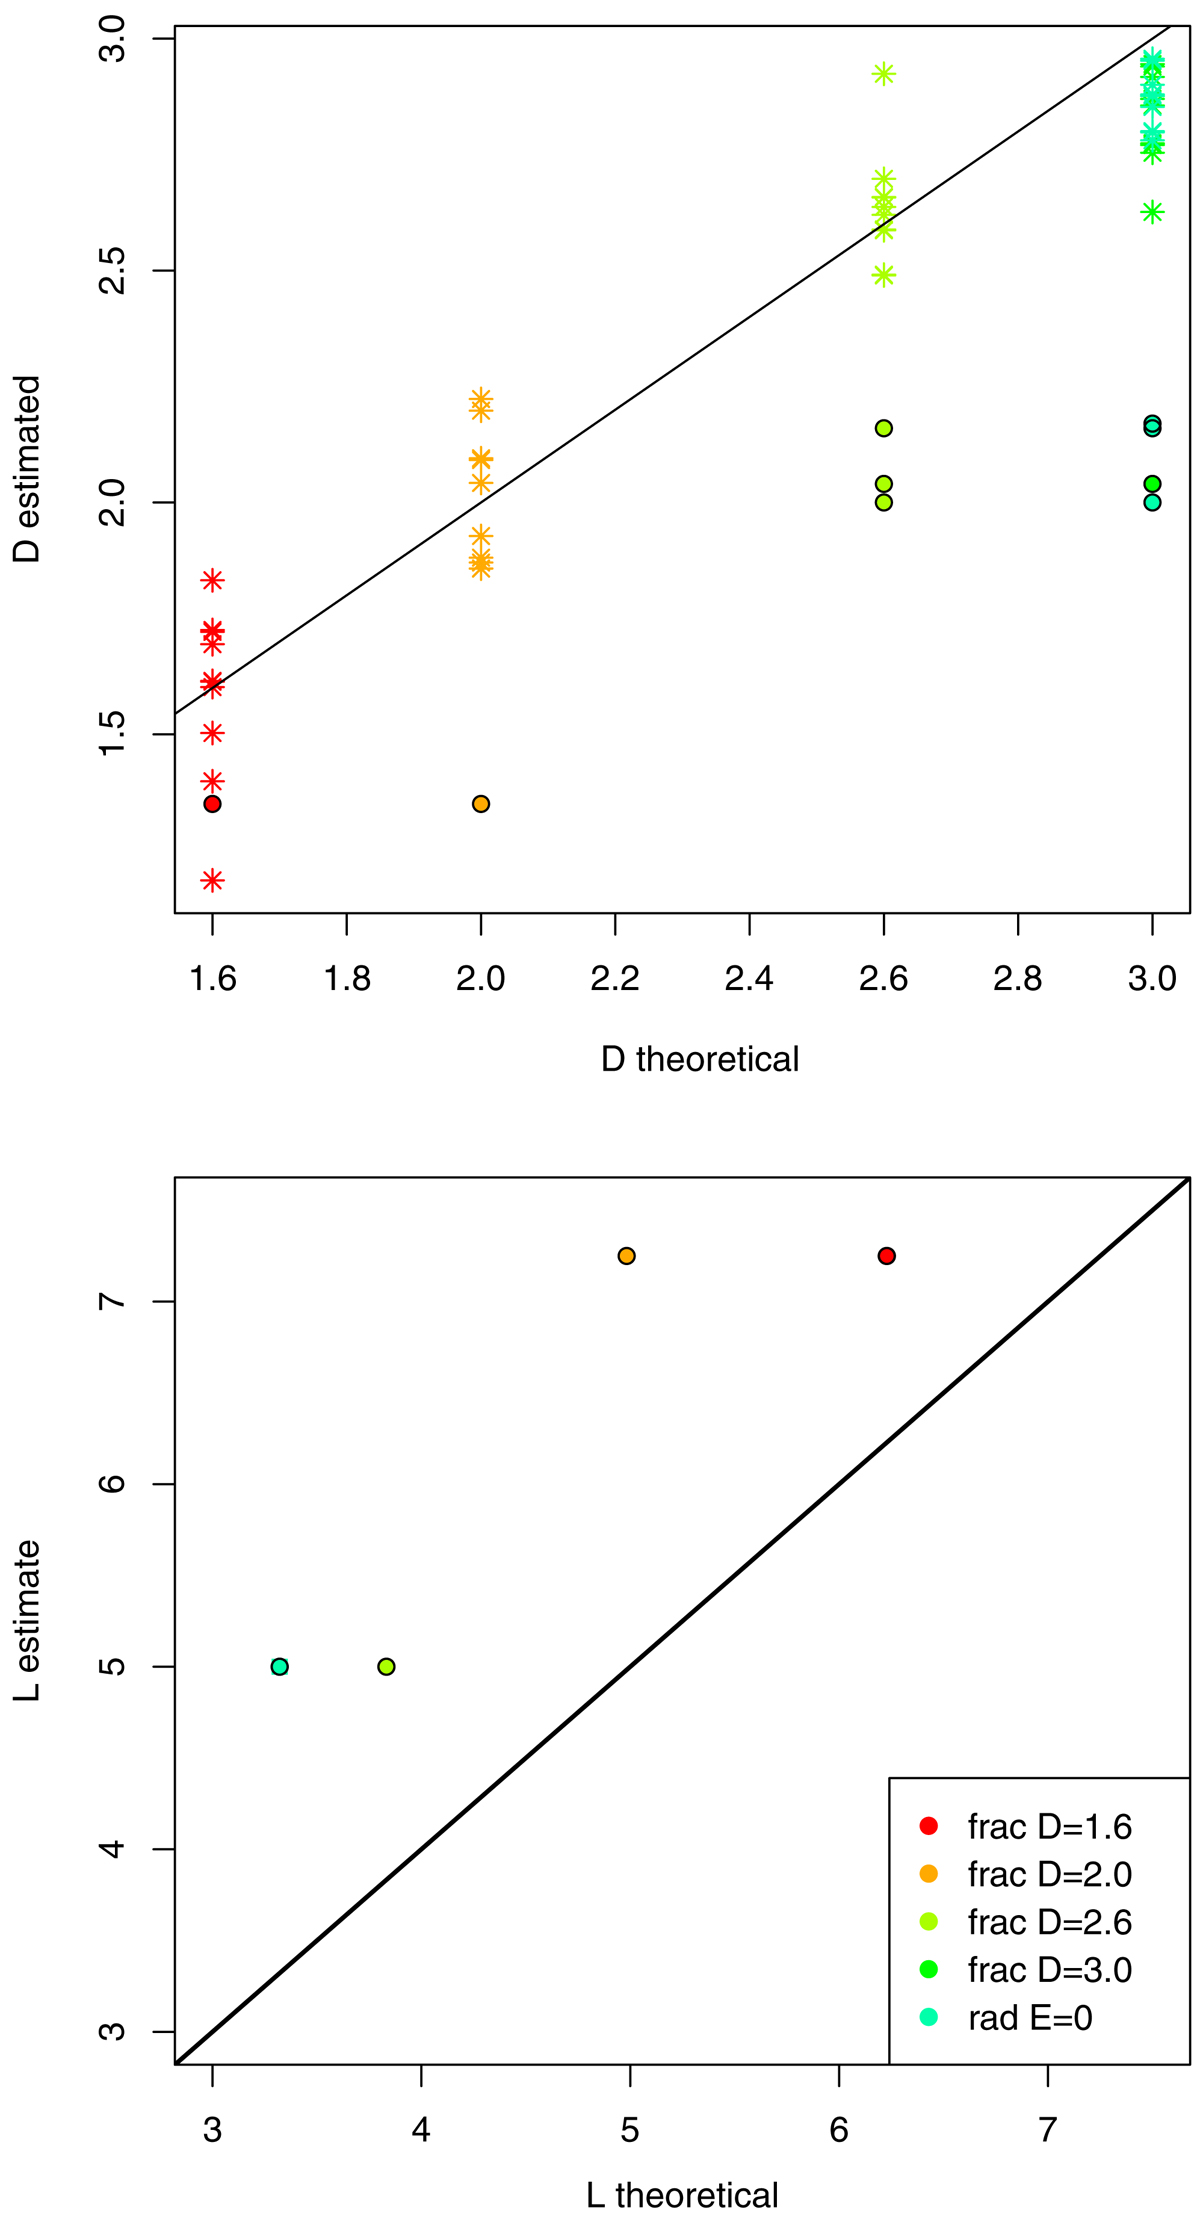
Fractal dimension estimated using the standard Q approach from CW04 (stars), and the Q+ from JF17 (black rimmed coloured dots) against the fractal dimension used to generate the clusters. Bottom: estimated against theoretical value of L for the simulated clusters considered in this work. Each colour represents a different true fractal dimension. The black line is the identity function, where the theoretical and estimated values are equal. Please note that the Fractal with D = 3 and the radial with E = 0 both represent a homogeneous distribution, and that some of the D estimates and all the L estimates given by Q+ overlap.
Current usage metrics show cumulative count of Article Views (full-text article views including HTML views, PDF and ePub downloads, according to the available data) and Abstracts Views on Vision4Press platform.
Data correspond to usage on the plateform after 2015. The current usage metrics is available 48-96 hours after online publication and is updated daily on week days.
Initial download of the metrics may take a while.