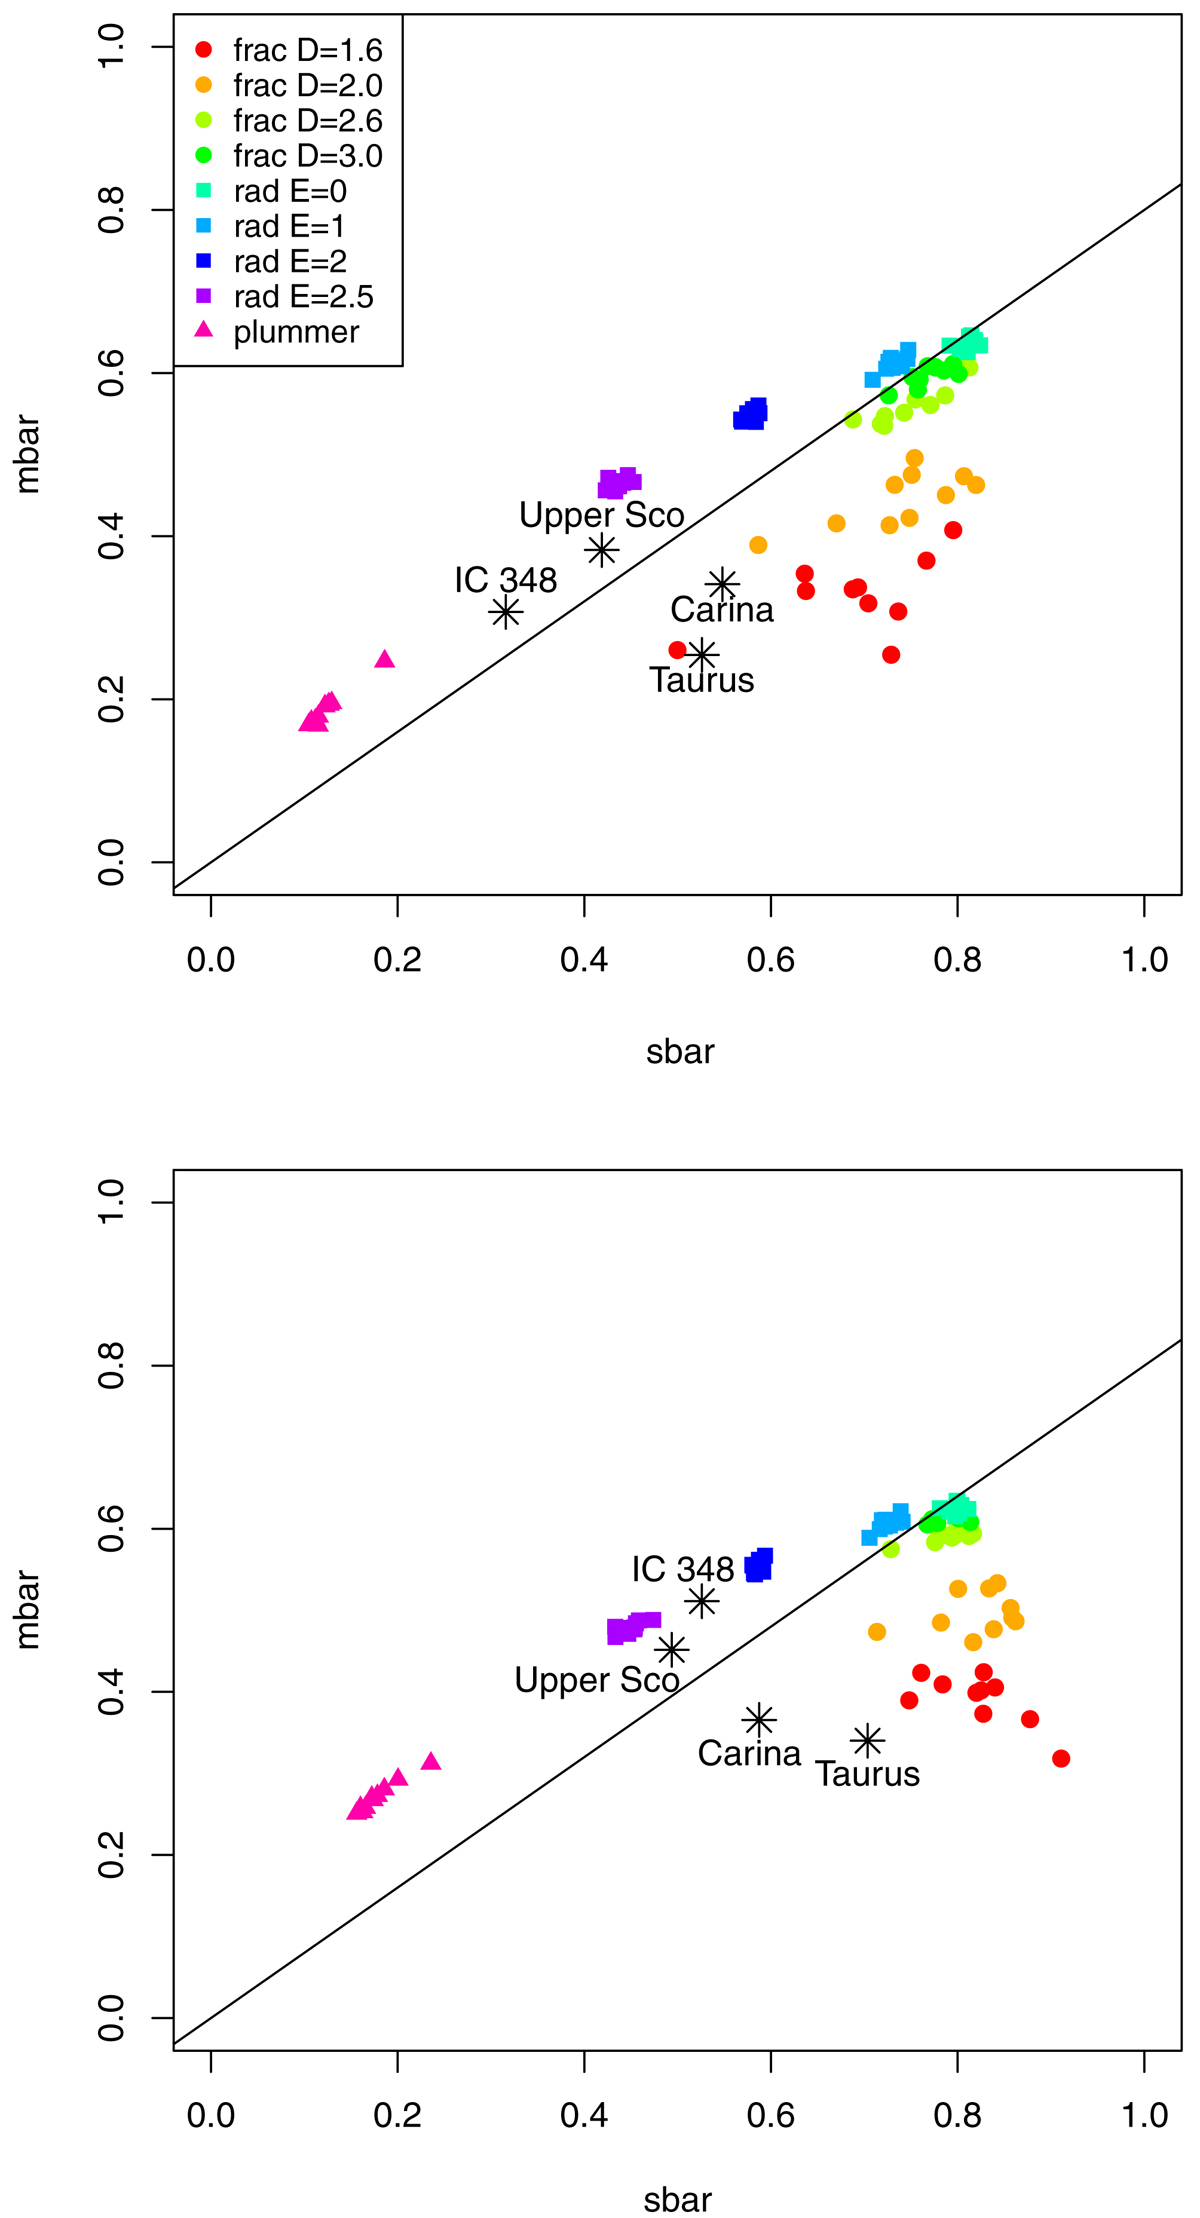
Fig. B.1.
![]() ,
, ![]() plots of the simulated clusters in this work, described in Fig. 1. Upper panel: original normalisation in CW04, lower plot: convex hull, proposed by Schmeja & Klessen (2006). Coloured circles, squares, and triangles represent fractal, radial, and Plummer distributions. Black stars represent the real clusters, each of them tagged appropriately. The black line represents the limit Q = 0.8 traditionally separating structured from concentrated clusters.
plots of the simulated clusters in this work, described in Fig. 1. Upper panel: original normalisation in CW04, lower plot: convex hull, proposed by Schmeja & Klessen (2006). Coloured circles, squares, and triangles represent fractal, radial, and Plummer distributions. Black stars represent the real clusters, each of them tagged appropriately. The black line represents the limit Q = 0.8 traditionally separating structured from concentrated clusters.
Current usage metrics show cumulative count of Article Views (full-text article views including HTML views, PDF and ePub downloads, according to the available data) and Abstracts Views on Vision4Press platform.
Data correspond to usage on the plateform after 2015. The current usage metrics is available 48-96 hours after online publication and is updated daily on week days.
Initial download of the metrics may take a while.