Fig. 14.
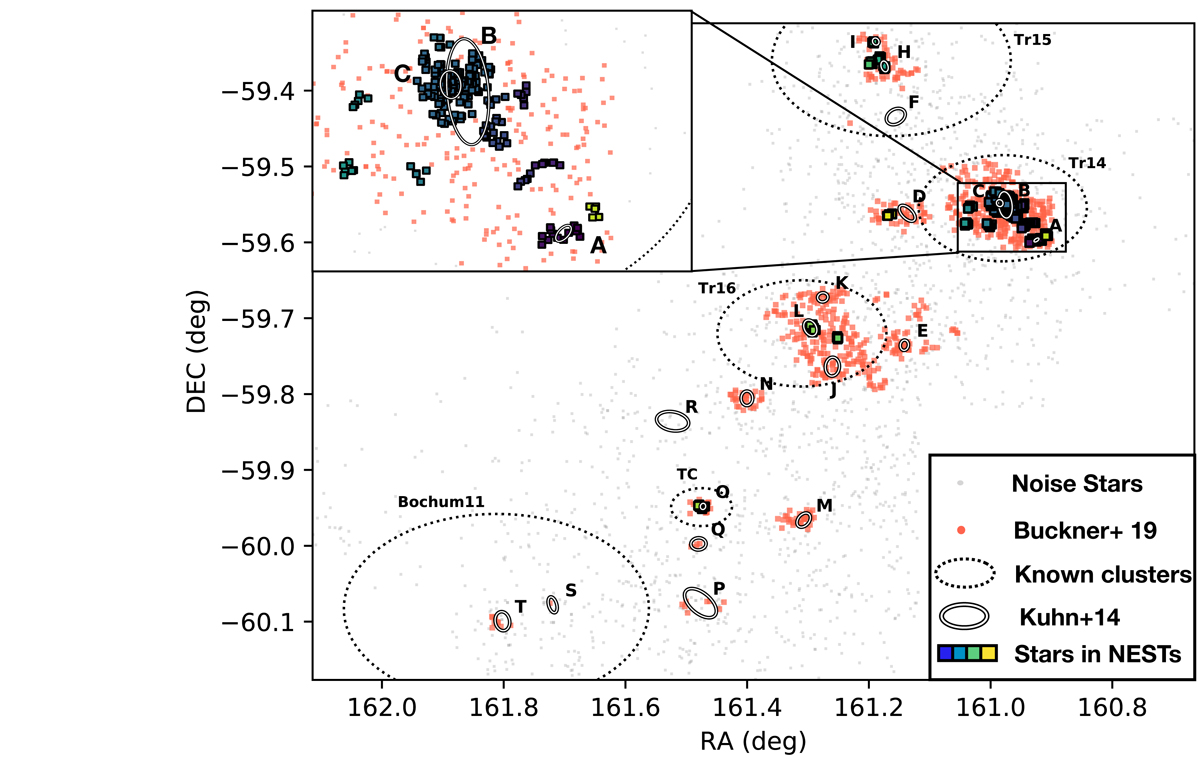
Position map (RA, Dec) of the Carina Nebula sample, comparing the results of S2D2 with those of B19 and K14. Dotted ellipses show the position of known clusters in the area, while black rimmed white ellipses show the structures obtained by Kuhn et al. (2014), tagged accordingly with letters. Noise stars are depicted as grey dots, the stars with significant clustering index I5 from Buckner et al. (2019) are coloured in red. Stars belonging to structures found by S2D2 are squares coloured following the same colour scheme as in Fig. 11, with different NESTS represented by different shades of purple, blue, yellow, and green.
Current usage metrics show cumulative count of Article Views (full-text article views including HTML views, PDF and ePub downloads, according to the available data) and Abstracts Views on Vision4Press platform.
Data correspond to usage on the plateform after 2015. The current usage metrics is available 48-96 hours after online publication and is updated daily on week days.
Initial download of the metrics may take a while.