Fig. 11.
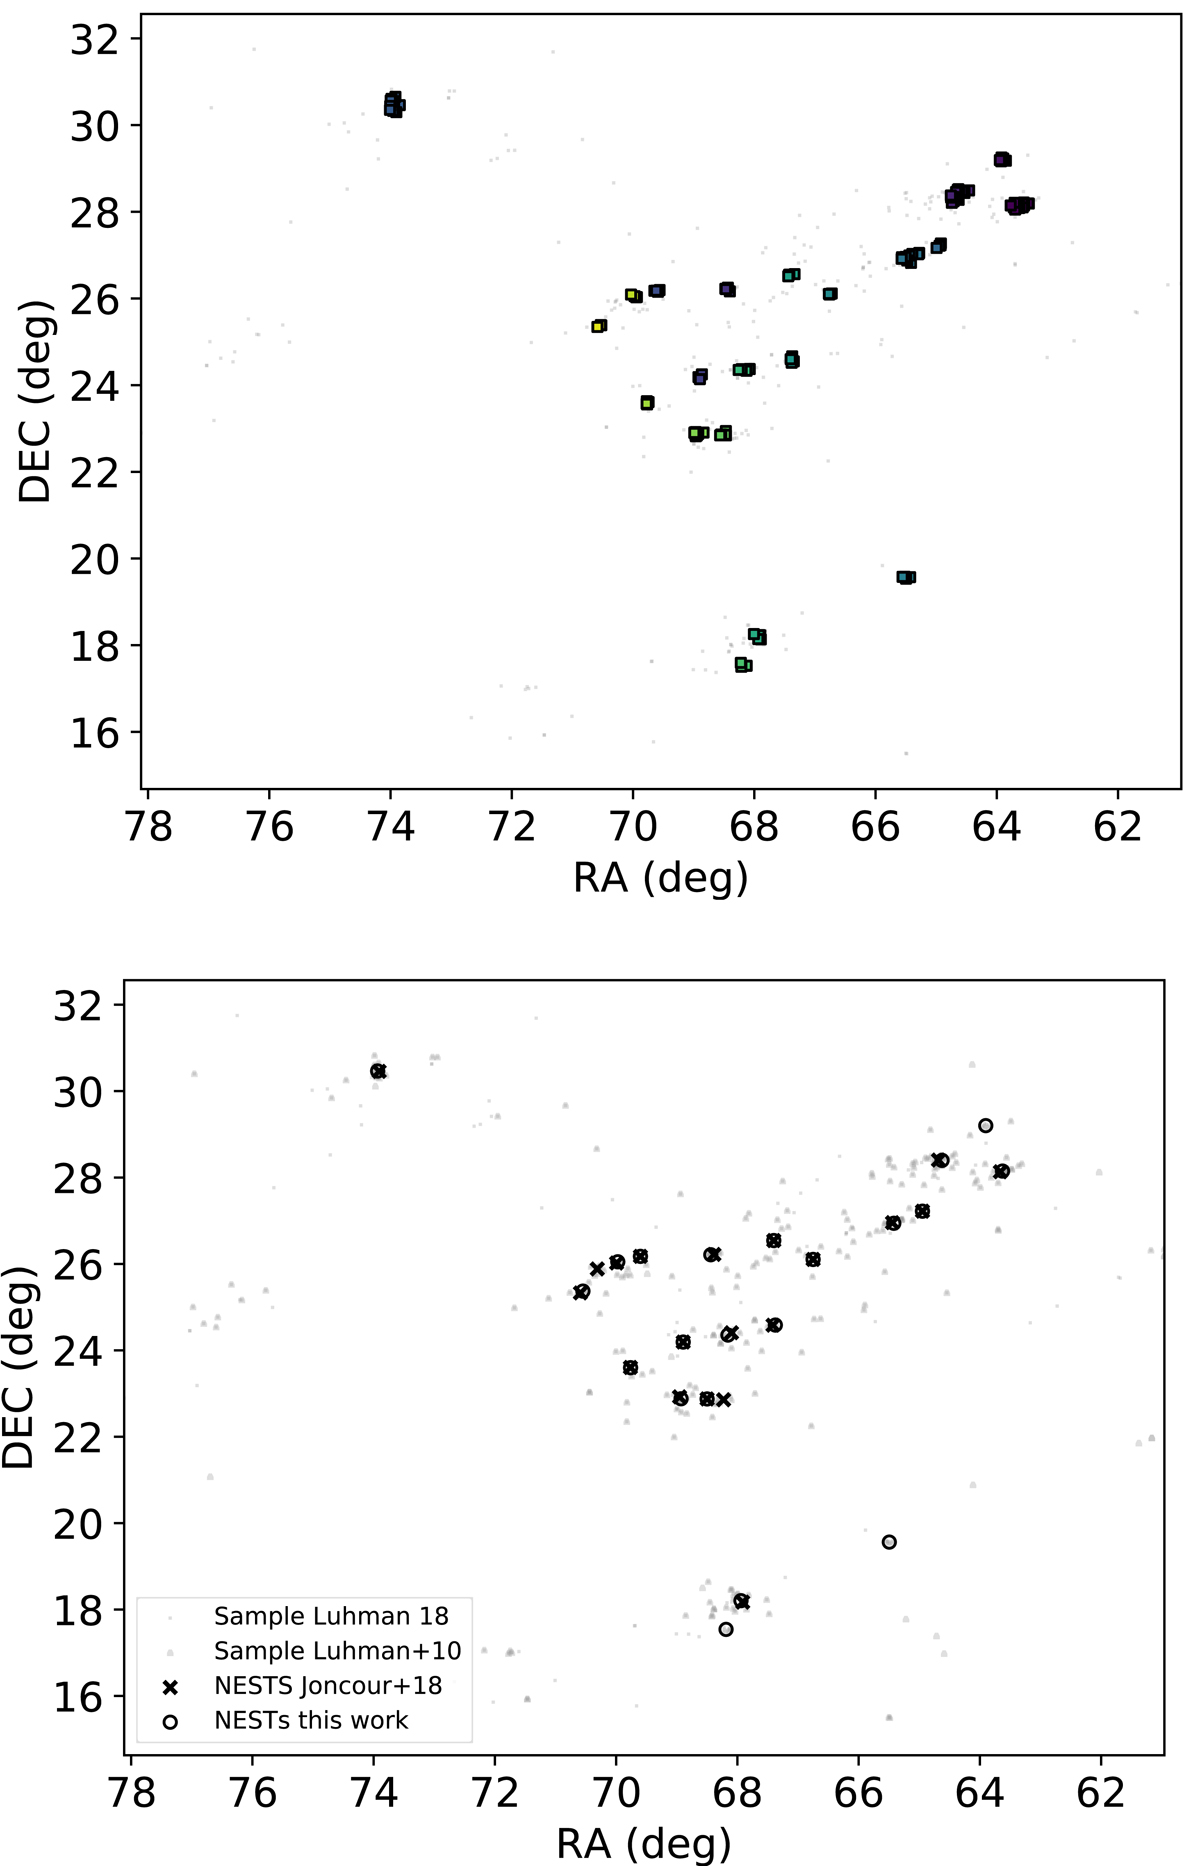
Top: position map (RA, Dec) of the Taurus sample. Noise stars are depicted as grey small dots, while stars belonging to the structures found are shown as coloured squares, with different shades of purple, blue, yellow, and green representing different small scale structures. Bottom: comparison of the position of the NESTs found in J18 and those detected in this work. Grey triangles show the stars from the analysis of Luhman et al. (2010), while grey circles show stars in the updated samples from Luhman (2018). Black symbols mark the centroids of the NESTs detected: crosses the NESTs found in J18, and empty circles the NESTs found in this work.
Current usage metrics show cumulative count of Article Views (full-text article views including HTML views, PDF and ePub downloads, according to the available data) and Abstracts Views on Vision4Press platform.
Data correspond to usage on the plateform after 2015. The current usage metrics is available 48-96 hours after online publication and is updated daily on week days.
Initial download of the metrics may take a while.