| Issue |
A&A
Volume 646, February 2021
|
|
|---|---|---|
| Article Number | L8 | |
| Number of page(s) | 9 | |
| Section | Letters to the Editor | |
| DOI | https://doi.org/10.1051/0004-6361/202040022 | |
| Published online | 10 February 2021 | |
Letter to the Editor
Predicted spatial and velocity distributions of ejected companion stars of helium accretion-induced thermonuclear supernovae
1
Max Planck Institut für Astrophysik, Karl-Schwarzschild-Straße 1, 85748 Garching bei München, Germany
e-mail: This email address is being protected from spambots. You need JavaScript enabled to view it.
2
Yunnan Observatories, Chinese Academy of Sciences, Kunming 650011, PR China
3
Institut für Physik und Astronomie, Universität Potsdam, Haus 28, Karl-Liebknecht-Str. 24/25, 14476 Potsdam-Golm, Germany
Received:
30
November
2020
Accepted:
15
January
2021
Abstract
Context. Thermonuclear supernovae (SNe), a subset of which are the highly important SNe Type Ia, remain one of the more poorly understood phenomena known to modern astrophysics. In recent years, the single degenerate helium (He) donor channel, where a white dwarf star accretes He-rich matter from a hydrogen-depleted companion, has emerged as a promising candidate progenitor scenario for these events. An unresolved question in this scenario is the fate of the companion star, which would be evident as a runaway hot subdwarf O/B stars (He sdO/B) in the aftermath of the SN event.
Aims. Previous studies have shown that the kinematic properties of an ejected companion provide an opportunity to closer examine the properties of an SN progenitor system. However, with the number of observed objects not matching predictions by theory, the viability of this mechanism is called into question. In this study, we first synthesize a population of companion stars ejected by the aforementioned mechanism, taking into account predicted ejection velocities, the inferred population density in the Galactic mass distribution, and subsequent kinematics in the Galactic potential. We then discuss the astrometric properties of this population.
Methods. We present 106 individual ejection trajectories, which were numerically computed with a newly developed, lightweight simulation framework. Initial conditions were randomly generated, but weighted according to the Galactic mass density and ejection velocity data. We then discuss the bulk properties (Galactic distribution and observational parameters) of our sample.
Results. Our synthetic population reflects the Galactic mass distribution. A peak in the density distribution for close objects is expected in the direction of the Galactic centre. Higher mass runaways should outnumber lower mass ones. If the entire considered mass range is realised, the radial velocity distribution should show a peak at 500 km s−1. If only close US 708 analogues are considered, there should be a peak at (∼750 − 850) km s−1. In either case, US 708 should be a member of the high-velocity tail of the distribution.
Conclusions. We show that the puzzling lack of confirmed surviving companion stars of thermonuclear SNe, though possibly an observation-related selection effect, may indicate a selection against high mass donors in the SD He donor channel.
Key words: stars: kinematics and dynamics / binaries: close / supernovae: general / subdwarfs
© P. Neunteufel et al. 2021
 Open Access article, published by EDP Sciences, under the terms of the Creative Commons Attribution License (https://creativecommons.org/licenses/by/4.0), which permits unrestricted use, distribution, and reproduction in any medium, provided the original work is properly cited.
Open Access funding provided by Max Planck Society.
1. Introduction
The study and theoretical characterisation of thermonuclear supernovae (SNe) is a long-standing issue in modern astrophysics. Chief among these are SNe of Type Ia, which, distinguished by their relatively uniform light curves and well-defined relation between peak luminosity and light curve shape, have been successfully used to measure the rate and acceleration of cosmic expansion (Nobel Prize 2011, see Perlmutter et al. 1999). Observationally, this class of stellar explosions is characterised by the lack of evidence for the presence of hydrogen and is associated with a number of related events. These related events include SNe of Type Iax (Li et al. 2003; Foley et al. 2013) and, possibly, certain calcium-enhanced Type Ib (Waldman et al. 2011; Neunteufel et al. 2017). Thermonuclear SNe derive their name from their assumed origin as thermonuclear explosions of white dwarf stars (WDs), the degenerate remnants of low to low-intermediate mass (≲8 M⊙) main sequence (MS) stars. Here, detonation is triggered by mass transfer from a companion star belonging to one of several possible types. This explosion mechanism is distinguished, on the theoretical side, from core collapse SNe, which are generally triggered by the gravitational collapse of the core of higher-mass (8 M⊙ ≲ M ≲ 40 M⊙) MS stars (see Sukhbold et al. 2016, for a review) and, at the highest masses, pair instability SNe (PISN) become a possibility (see Heger & Woosley 2002, for reviews). We note that PISN are also thermonuclear in nature, but without involvement of a WD.
Thermonuclear SNe (of the type under consideration here) are generally categorized, depending on the structure of their progenitor systems, into two distinct channels: double degenerate (DD), where the companion is another WD, and single degenerate (SD), where the companion is a non-degenerate star, such as an MS star (see Hillebrandt & Niemeyer 2000; Ruiter 2020, for reviews). An open question in studies of the SD channel pertains to the nature of the non-degenerate companion, with stars on the MS, red giant branch (RGB), and hydrogen depleted stars (hereafter: He-stars) either during or after their core helium (He) burning phase; this has been proposed and studied by different authors (e.g., Nomoto 1982; Woosley & Kasen 2011; Brooks et al. 2017).
However, regardless of its structure, the donor star is expected to survive the accretor’s detonation and, hence, the SN, in all viable SD scenarios (see, e.g., Liu et al. 2015; Liu & Zeng 2020). If, in the aftermath of a thermonuclear SN, the accretor is completely disrupted, then the former donor star is, according to conservation of orbital angular momentum, flung away from the location of the progenitor system at a velocity, due to an ejecta interaction, that is slightly higher than its pre-detonation orbital velocity, as dictated by the involved masses and the binary orbital separation (Bauer et al. 2019). Discarding certain super-Chandrasekhar-mass mechanisms (see, e.g., Di Stefano et al. 2011), which lie outside the parameter space considered in this study, detonation is presumably triggered by mass transfer from the non-degenerate donor star, the donor star can be assumed to be filling its Roche lobe at the point of detonation. The final attainable orbital separation, and thus runaway velocity, is thus dictated by the radius of the donor star. Consequently, the lowest runaway velocities are expected in progenitor binaries containing a low mass RGB donor, followed by He-giants and typical MS stars. The highest runaway velocities in the SD channel are expected to require a low-mass, hydrogen depleted star (Justham et al. 2009; Neunteufel 2020). If the plethora of channels leading to thermonuclear SNe, independent of their observational characteristics as canonical SNe Ia or a related type, include the single degenerate He-donor channel in any significant capacity, there should exist a population of surviving donor stars of which US 708 is a member. In this study, we predict the spatial and velocity distribution of this hypothetical population and attempt to both explain and draw conclusions from the current absence of US 708 analogues from the observational record.
For most reasonable terminal mass combinations, the ejected donor star in this scenario is expected to move at sufficiently high velocities post-ejection to become unbound from the Galaxy. Such unbound stars are, in addition to their other attributes, commonly called hypervelocity stars (HVS). Many observed HVS, particularly the more massive specimens (Hills 1988; Brown 2015, the latter being a recent review) are thought to originate from encounters of binary star systems with the supermassive black hole at the centre of the Galaxy, with one object (Koposov et al. 2020) having been traced back to this origin with a high probability. HVS originating from the Galactic centre have also attracted attention as tracers of the Galactic mass distribution (Yu & Madau 2007). A substantial body of work (e.g., Brown et al. 2009; Lu et al. 2010; Rossi et al. 2014) has considered the kinematic properties of these objects. Possible origins as former companion stars have also been considered (Evans et al. 2020) and the search for HVS of all masses is ongoing (Raddi et al. 2021; Li et al. 2021). However, at the low-mass end of the mass distribution, a number of objects have been detected (Geier et al. 2015; Vennes et al. 2017; Shen et al. 2018), which have likely been ejected in thermonuclear SN events. Of these, the hot subdwarf US 708 is of particular interest, as its current structure, composition, and velocity suggest it to be a likely product of the He donor SD channel (Geier et al. 2015; Neunteufel 2020, hereafter G15 and N20 respectively).
Unlike surviving companions resulting from different candidate progenitor channels, US 708 analogues (i.e. hypervelocity hot subdwarfs) are, again due to their composition and velocity, relatively clearly identifiable, if not easily detectable. However, with the direct observation of clear thermonuclear SN progenitor systems not forthcoming, analysis of their surviving ejected companions would offer an avenue of investigation into the terminal state of thermonuclear SN progenitor systems which would not be available otherwise. An open question in this regard is whether the serendipitous detection of US 708, which can be described as being sui generis, indeed suggests a, as of yet undetected, population of US 708 analogues. Belonging to the class of He-enriched hot subdwarf O (sdO) stars, US 708 is currently the only known unbound hypervelocity He-star. To date about 6000 hot subdwarfs are known (Geier 2020; Heber 2016), which are found in all Galactic populations (Luo et al. 2020). Several fast, yet still bound hot subdwarfs have been discovered (Tillich et al. 2011; Németh et al. 2016; Ziegerer et al. 2017) and the halo population contains many more sdO/Bs with quite extreme, that is marginally bound, orbits (Luo et al. 2020). Distinguishing between bound runaways and halo stars based on their kinematics is therefore not straightforward.
This Letter is aimed at predicting the most likely kinematic properties of such a hypothetical population of US 708 analogues, taking into account, as much as possible, uncertainties in the areas of explosion mechanism, terminal component mass, and predicted scatter in runaway velocities. Movement in both the Galactic potential and the Galactic density distribution is fully considered.
2. Physical assumptions
As stated above, the SN channel under consideration here is the SD He-donor channel. More specifically, we consider the case of the mass donor being a low-mass hydrogen depleted, core-He burning star (i.e. a He sdO/B). This channel was studied in detail by N20, who show that the ejection velocities of runaways produced with this mechanism are largely dictated by the terminal donor and accretor masses, not the history of the binary following the emergence of its terminal structure as a system consisting of a He subdwarf and a WD, nor the amount of transferred material. The ejection locations in this study are assumed to lie in the Galactic disc and outside of clusters and close associations, but we do not expect our results to change significantly if this assumption is relaxed (see detailed discussion in Appendix B). This study relies on a combination of the results of detailed stellar evolution calculations with stellar kinematics (as detailed below), which does allow a large number of experiments to be performed while being relatively inexpensive computationally.
2.1. Initial conditions of the run
The initial conditions for our population consist of the ejection velocity for each ejected runaway subdwarf, which is a function of its mass, the ejection location, that is to say the location of the progenitor binary within the Galactic mass distribution, and the ejection direction, that is the direction with respect to Galactic rest frame coordinates in which the runaway is ejected. Each of these parameters was generated randomly (see Appendix A.2). We briefly note that velocities, as a function of mass, were chosen based on the velocity spectra presented by N20 (see Appendix A.3 for details), all ejections are assumed to originate in the Galactic plane (i.e. zGal = 0), and the initial radial distance from the Galactic centre is weighted (see Appendix A.4 for details) according to the density distribution obtained by Irrgang et al. (2013).
2.2. Kinematic simulation
Based on our randomly generated set of initial conditions, we used the SHyRT framework (see Appendix A.1) to calculate the resulting runaway trajectories. Specifically, using the given model Galactic potential, we calculated the average orbital velocity at the point of ejection and, taking into account the ejection direction and ejection velocity with respect to the centre of mass of the progenitor binary, we calculated the Galactic rest frame velocity of the ejected star. We then allowed each ejected star to move in the Galactic potential (see Appendix A.5 for details) for a span of 300 Myr, which is somewhat longer than the maximum nuclear timescale of a low mass (∼0.45 M⊙) He-star (see Appendix A.6).
2.3. Synthesis of the runaway population
The resulting trajectory data were then post-processed to generate the expected runaway population. This was accomplished by assigning a timestamp, corresponding to time intervals mimicking the inferred Galactic SN Ia rate, to each trajectory. The ejection interval is assumed to be constant for the duration covered by the simulation at 3 × 10⁻³ yr−1 (Cappellaro et al. 1997). This assumption is at odds with SN Ia rates following a delay time distribution conforming to ≈1/t (Ruiter et al. 2009; Maoz et al. 2011). Imposing this condition in a trial run leads to a decrease in the ejection rate over the time frame of our calculations of the order of ∼2 − 3% and has a negligible effect on our results. A similar argument applies to the question of the Galactic star formation history. Thermonuclear SNe resulting from the channel under discussion here are generally thought to occur less then 1 Gyr (see e.g., Wang et al. 2013, who argue for < 800 Myr) after starburst. In the relevant time frame of about 1 Gyr, the Galactic star formation rate has been approximately constant (Figer et al. 2004; Xiang et al. 2018). As our trajectory calculations used a basic time step of 1 Myr, intermediate positions were interpolated from the data. Furthermore, trajectories were truncated according the nuclear timescales of typical He-stars of the respective masses (see Appendix A.6). Time-dependent evolution of the population can be expected. Truncation of the He-star lifetime leads to an equilibrium between objects being removed from the sample and replenishment of the population through continuous ejection. Close US 708 analogues (with masses in the range of 0.35 M⊙ ≤ M ≤ 0.4 M⊙), due to their lifetimes exceeding 300 Myr, are not affected by this prescription. These objects will be ejected with velocities exceeding 800 km s−1 and can be assumed to have moved sufficiently during that time to likely be inaccessible for observation.
3. Results
The reader should note that we base our analysis on two different premises: first, we assume that the population consists of runaways, in a flat distribution, of the entire range of masses (0.2 M⊙ ≤ M ≤ 0.8 M⊙) and, second, a truncated distribution with only runaways of masses 0.35 M⊙ ≤ M ≤ 0.4 M⊙ is taken into consideration. The latter is chosen to represent close analogues of the observed star US 708, which was previously inferred to have a current mass in the range of 0.3 M⊙ ≤ M ≤ 0.4 M⊙ (G15, N20) with a terminal accretor mass corresponding to the assumed 1.4 M⊙ in this study. According to Bauer et al. (2019), this leads to a pre-detonation mass estimate of ∼0.35 M⊙ ≤ M ≤ 0.4 M⊙. The former distribution is referred to as the ‘full sample’, while the latter is referred to as the ‘reduced sample’. The total number of objects in the reduced sample (encompassing two out of a total of 13 discrete terminal mass values, compare Appendix A.3) represents about 15% of the full sample. We also note that the main goal here is not to provide predictions as to the total number of observable objects, as uncertainties in the production rate of the progenitor systems, as well as detonation mechanisms inhibiting the unambiguous identification of spectrally classified SNe and progenitor systems, are still too great to overcome (see, however, Wang et al. 2013, who estimate the rate of He donor induced SNe to account for about a third of the inferred Galactic SN Ia rate). Instead, we present relative normalised number densities, corresponding to a probability distribution for the most likely observable characteristics.
3.1. The galactocentric distribution
We present results for the galactocentric distribution of our synthetic population in Fig. 1. As shown in Figs. 1A and B, the resulting distribution is essentially cylindrically symmetric. The apparent peak in the density distribution around the Galactic centre (xGal = 0, yGal = 0) is a result of the, somewhat dispersed, initial distribution conforming to the Galactic density distribution. A noticeable peak in the density distribution at the location of the Galactic disc (zGal = 0) is apparent, reflecting both the initial distribution (projected onto the z-axis) and deflection of the random ejection direction due to Galactic rotation. At this point, we conclude that, neglecting instrument-related selection effects, observations focused towards the Galactic centre will yield a higher probability of new discoveries. Further, observations should – assuming that the entire mass range is encountered in reality – yield a higher ratio of more massive runaways close to the Galactic centre and the Galactic disc, and numbers of less massive (and therefore longer lived) runaways being reduced as these objects are ejected. Concurrently, more massive runaways will encounter the end of their He burning lifetime at shorter distances from their ejection locations both due to their shorter lifetimes and their slower ejection velocity.
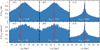 |
Fig. 1. Normalised number density distributions of the synthetic population in Galactic Cartesian coordinates as labelled. Upper panels: entire mass range (full sample) of runaway masses, lower panels: the same for the US 708-analogue sub-sample (reduced sample). The relative position of Earth along each axis is as indicated. We note that the distribution extends beyond the plotted range in all subplots, and the depicted range was chosen for clarity. |
3.2. The observational distribution
The celestial coordinate distribution in right ascention (RA) and declination (Dec) of our sample, as well as the distance, are summarised in Fig. 2. We note that here we focus on ‘closer’ objects (distance D < 20 kpc) in both sub-figures (A) and (B). We note a significant peak both in RA and Dec (RA = 275 deg, Dec = −27 deg). These peaks are present in both the full sample and in the reduced sample and coincide with the position of the Galactic centre. Noticeably, the current position of US 708 does not correspond to the predicted positions of the peaks. The distance distributions (measured from the position of Earth) show a plateau at ∼20 kpc in the full distribution; it is important to note that this plateau forms a peak when larger distances are included. This is in contrast to the reduced distribution where the same peak is located at ∼190 kpc (see Appendix D). These peaks are essentially a reflection of the object number densities being integrated over the entire celestial sphere (compare Fig. A.2). However, the location of these peaks is instructive of the effect discussed in Sect. 3.1, with numbers of lower mass runaways being attenuated due to their higher runaway velocities. If the entire mass range is realised in nature, observations should encounter a relatively higher number of higher mass runaways in the Solar environment than lower mass ones. While there may be a significant observational bias against the detection of higher mass He-stars (see discussion in Appendix C), the only observed object being of a lower mass may be an indication that higher mass runaways are selected against. The latter conclusion is significant insofar as donor stars in the He-donor scenario for thermonuclear SNe, particularly in the double detonation scenario, are thought to possess higher masses under most conditions (M > 0.8 M⊙, see Neunteufel et al. 2016).
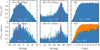 |
Fig. 2. Observational characteristics of our synthetic population in right ascension (RA), declination (Dec), and heliocentric distance (D). Upper panels: entire mass range (full sample) of runaway masses, lower panels: the same for the US 708-analogue sub-sample (reduced sample). The full distribution, the D-distribution (panel C1), is shown in orange in panel C2 for comparison. Relative positions of the Galactic centre (GC) and US 708 are given for reference. We note that in RA and Dec the sample is restricted to objects closer than 20 kpc. See Appendix D for an extended plot of the distance distribution (C1 and C2). |
We present the distribution for parameters of motion in Fig. 3. Again we truncated the sample at a distance of D < 20 kpc. We give the parameters of motion for US 708 for reference. While there are pronounced peaks in the proper motions for the full sample, these peaks are much less pronounced in the reduced sample. In both cases these peaks are located around the zero axis, reflecting objects at greater distances dominating the population. In both cases, values of more than 20 mas yr−1 can be expected, mostly representing objects being ejected from the Galactic centre perpendicular to the line of sight. In both cases, the distribution being shifted towards positive velocities is a geometric effect. Noticeably, there is a pronounced peak in the radial velocities present in both the full sample (∼500 km−1) and the reduced sample (∼750 − 850 km−1). US 708 lies in the high-velocity tail of both samples. In any case, we conclude that proper motion is likely not a promising observational filter for these objects with searches for high radial velocities being more attractive.
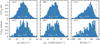 |
Fig. 3. Parameters of motion of our synthetic population, truncated at a distance of D = 20 kpc with proper motions in RA (μRA) and Dec (μDec) as labelled. Further, RV is the radial velocity (i.e. velocity along the line of sight). |
4. Conclusions
Combining pre-existing data obtained via detailed stellar evolution calculations, model Galactic potential and density distribution, and numerical kinematic calculations, we have constructed a synthetic population of US 708 analogue HVS from a sample of 106 individual ejection trajectories. From this synthetic distribution, we derived predictions for the most likely observational characteristics of members of this hypothetical population. Most importantly, we find that, if the entire mass range of ejected He-star masses is encountered in nature, which cannot be reliably inferred from the currently sui generis US 708, there should be a significant excess of higher mass runaways over lower mass ones close to Earth. This prediction is at odds with the only observed object, US 708, which is likely a lower mass star. This, in itself, contains a discrepancy at least with theoretical models on the double detonation scenario predicting higher mass donor stars. This discrepancy may imply that higher mass donor stars are selected against in the pre-SN evolution of the progenitor binary, in which case all observed runaway He donor stars can be expected to possess masses comparable to that of US 708. We further find that high velocity runaways in our sample are primarily distinguished by high radial velocity, with the probability distribution of the entire sample peaking at ∼500 km s−1, the reduced sample peaking at (∼750 − 850 km s−1), with US 708 located in the high-velocity tail of either distribution. We note that US 708 has been discovered based on a spectrum taken during the Sloan Digital Sky Survey (Hirsch et al. 2005) and most subsequent searches were based on new releases of SDSS. Hot subdwarfs are most easily detected as faint blue stars at high Galactic latitudes. According to our predictions, the currently available survey area at high Galactic latitudes in the Northern Hemisphere turns out to be the worst choice to search for a sdO/B runaway because it leaves out both the disc and the bulge. Southern surveys such as SDSS-V and 4MOST will likely be much more suited in this respect. We conclude that the apparent lack of US 708 analogues might, to a large extent, be due to strong observational selection effects. These can be overcome by conducting deep spectroscopic surveys in the south, obtaining high-quality spectra of carefully selected candidates, improving the models to fit them, and also by checking the classifications and parameters of potentially misclassified bright candidates from the literature.
However, the currently apparent lack of US 708 analogues in the observational record has to be taken into account. Should upcoming research fail to produce additional candidates, the overall viability and prevalence of the SD He donor channel should be seen as seriously challenged on the theoretical side.
Unless stated otherwise, random numbers were generated using the rd()-function, contained in the ⟨random⟩-library for c++.
That is to say, the total number of objects is  .
.
Here, we ignore the possibility of interactions with binary or higher-order stars.
Acknowledgments
PN and ASH would like to thank Holly Preece for useful discussions. ASH thanks the Max Planck Society for support through a Max Planck Research Group. MK is partly supported by Grant No 11521303 and 11733008 of the Natural Science Foundation of China.
References
- Allen, C., & Santillan, A. 1991, Rev. Mex. Astron. Astrofis., 22, 255 [NASA ADS] [Google Scholar]
- Bauer, E. B., White, C. J., & Bildsten, L. 2019, ApJ, 887, 68 [NASA ADS] [CrossRef] [Google Scholar]
- Binney, J., & Tremaine, S. 2008, Galactic Dynamics: Second Edition (Princeton: Princeton University Press) [Google Scholar]
- Brooks, J., Schwab, J., Bildsten, L., Quataert, E., & Paxton, B. 2017, ApJ, 843, 151 [NASA ADS] [CrossRef] [Google Scholar]
- Brown, W. R. 2015, ARA&A, 53, 15 [Google Scholar]
- Brown, W. R., Geller, M. J., Kenyon, S. J., & Bromley, B. C. 2009, ApJ, 690, L69 [NASA ADS] [CrossRef] [Google Scholar]
- Cappellaro, E., Turatto, M., Tsvetkov, D. Y., et al. 1997, A&A, 322, 431 [Google Scholar]
- Di Stefano, R., Voss, R., & Claeys, J. S. W. 2011, ApJ, 738, L1 [NASA ADS] [CrossRef] [Google Scholar]
- Dorsch, M., Latour, M., Heber, U., et al. 2020, A&A, 643, A22 [EDP Sciences] [Google Scholar]
- Evans, F. A., Renzo, M., & Rossi, E. M. 2020, MNRAS, 497, 5344 [Google Scholar]
- Figer, D. F., Rich, R. M., Kim, S. S., Morris, M., & Serabyn, E. 2004, ApJ, 601, 319 [NASA ADS] [CrossRef] [Google Scholar]
- Foley, R. J., Challis, P. J., Chornock, R., et al. 2013, ApJ, 767, 57 [NASA ADS] [CrossRef] [Google Scholar]
- Geier, S. 2020, A&A, 635, A193 [CrossRef] [EDP Sciences] [Google Scholar]
- Geier, S., Fürst, F., Ziegerer, E., et al. 2015, Science, 347, 1126 [NASA ADS] [CrossRef] [Google Scholar]
- Geier, S., Raddi, R., Gentile Fusillo, N. P., & Marsh, T. R. 2019, A&A, 621, A38 [NASA ADS] [CrossRef] [EDP Sciences] [Google Scholar]
- Gnedin, O. Y., Zhao, H., Pringle, J. E., et al. 2002, ApJ, 568, L23 [NASA ADS] [CrossRef] [Google Scholar]
- Heber, U. 2016, PASP, 128, 082001 [NASA ADS] [CrossRef] [Google Scholar]
- Heger, A., & Woosley, S. E. 2002, ApJ, 567, 532 [NASA ADS] [CrossRef] [Google Scholar]
- Hillebrandt, W., & Niemeyer, J. C. 2000, ARA&A, 38, 191 [NASA ADS] [CrossRef] [Google Scholar]
- Hills, J. G. 1988, Nature, 331, 687 [Google Scholar]
- Hirsch, H. A., Heber, U., O’Toole, S. J., & Bresolin, F. 2005, A&A, 444, L61 [NASA ADS] [CrossRef] [EDP Sciences] [Google Scholar]
- Irrgang, A., Wilcox, B., Tucker, E., & Schiefelbein, L. 2013, A&A, 549, A137 [NASA ADS] [CrossRef] [EDP Sciences] [Google Scholar]
- Irrgang, A., Geier, S., Heber, U., Kupfer, T., & Fürst, F. 2019, A&A, 628, L5 [NASA ADS] [CrossRef] [EDP Sciences] [Google Scholar]
- Justham, S., Wolf, C., Podsiadlowski, P., & Han, Z. 2009, A&A, 493, 1081 [NASA ADS] [CrossRef] [EDP Sciences] [Google Scholar]
- Koposov, S. E., Boubert, D., Li, T. S., et al. 2020, MNRAS, 491, 2465 [NASA ADS] [CrossRef] [EDP Sciences] [Google Scholar]
- Li, W., Filippenko, A. V., Chornock, R., et al. 2003, PASP, 115, 453 [NASA ADS] [CrossRef] [Google Scholar]
- Li, Y.-B., Luo, A.-L., Lu, Y.-J., et al. 2021, ApJS, 252, 3 [Google Scholar]
- Liu, Z.-W., & Zeng, Y. 2020, MNRAS, 500, 301 [Google Scholar]
- Liu, Z.-W., Moriya, T. J., Stancliffe, R. J., & Wang, B. 2015, A&A, 574, A12 [NASA ADS] [CrossRef] [EDP Sciences] [Google Scholar]
- Lu, Y., Zhang, F., & Yu, Q. 2010, ApJ, 709, 1356 [NASA ADS] [CrossRef] [Google Scholar]
- Luo, Y., Németh, P., & Li, Q. 2020, ApJ, 898, 64 [Google Scholar]
- Maoz, D., Mannucci, F., Li, W., et al. 2011, MNRAS, 412, 1508 [NASA ADS] [CrossRef] [Google Scholar]
- Moehler, S., Heber, U., & Durell, P. R. 1997, A&A, 317, 83 [Google Scholar]
- Németh, P., Ziegerer, E., Irrgang, A., et al. 2016, ApJ, 821, L13 [NASA ADS] [CrossRef] [Google Scholar]
- Neunteufel, P. 2020, A&A, 641, A52 [EDP Sciences] [Google Scholar]
- Neunteufel, P., Yoon, S.-C., & Langer, N. 2016, A&A, 589, A43 [NASA ADS] [CrossRef] [EDP Sciences] [Google Scholar]
- Neunteufel, P., Yoon, S.-C., & Langer, N. 2017, A&A, 602, A55 [NASA ADS] [CrossRef] [EDP Sciences] [Google Scholar]
- Nomoto, K. 1982, ApJ, 253, 798 [Google Scholar]
- Perlmutter, S., Aldering, G., Goldhaber, G., et al. 1999, ApJ, 517, 565 [NASA ADS] [CrossRef] [Google Scholar]
- Press, W. H., Teukolsky, S. A., Vetterling, W. T., & Flannery, B. P. 1992, Numerical Recipes in C. The Art of Scientific Computing (Cambridge: Cambridge University Press) [Google Scholar]
- Raddi, R., Irrgang, A., Heber, U., Schneider, D., & Kreuzer, S. 2021, A&A, 645, A108 [EDP Sciences] [Google Scholar]
- Rossi, E. M., Kobayashi, S., & Sari, R. 2014, ApJ, 795, 125 [NASA ADS] [CrossRef] [Google Scholar]
- Ruiter, A. J. 2020, IAU Symp., 357, 1 [Google Scholar]
- Ruiter, A. J., Belczynski, K., & Fryer, C. 2009, ApJ, 699, 2026 [NASA ADS] [CrossRef] [Google Scholar]
- Schindewolf, M., Németh, P., Heber, U., et al. 2018, A&A, 620, A36 [NASA ADS] [CrossRef] [EDP Sciences] [Google Scholar]
- Shen, K. J., Boubert, D., Gänsicke, B. T., et al. 2018, ApJ, 865, 15 [Google Scholar]
- Sukhbold, T., Ertl, T., Woosley, S. E., Brown, J. M., & Janka, H.-T. 2016, ApJ, 821, 38 [Google Scholar]
- Tillich, A., Heber, U., Geier, S., et al. 2011, A&A, 527, A137 [NASA ADS] [CrossRef] [EDP Sciences] [Google Scholar]
- Vennes, S., Nemeth, P., Kawka, A., et al. 2017, Science, 357, 680 [Google Scholar]
- Waldman, R., Sauer, D., Livne, E., et al. 2011, ApJ, 738, 21 [NASA ADS] [CrossRef] [Google Scholar]
- Wang, B., Justham, S., & Han, Z. 2013, A&A, 559, A94 [NASA ADS] [CrossRef] [EDP Sciences] [Google Scholar]
- Woosley, S. E., & Kasen, D. 2011, ApJ, 734, 38 [Google Scholar]
- Xiang, M., Shi, J., Liu, X., et al. 2018, ApJS, 237, 33 [NASA ADS] [CrossRef] [Google Scholar]
- Yu, Q., & Madau, P. 2007, MNRAS, 379, 1293 [NASA ADS] [CrossRef] [Google Scholar]
- Ziegerer, E., Heber, U., Geier, S., et al. 2017, A&A, 601, A58 [NASA ADS] [CrossRef] [EDP Sciences] [Google Scholar]
Appendix A: Remarks on the methodology
A.1. Numerical framework
In this study, we used a lightweight stellar kinematics framework (‘SHyRT’) to compute the ejection trajectories of our sample. The SHyRT-framework (Simulated Hypervelocity Runaway Trajectories) is a newly developed, lightweight numerical tool designed to rapidly compute the movement of ejected stars in the Galactic gravitational potential and provide synthetic astrometric observables of the calculated trajectories. At its core, the SHyRT framework solves the basic Newtonian equations of motions in the following form
 (A.1)
(A.1)
utilising a fourth-order Runge-Kutta integration scheme with adaptive step size control as described by Press et al. (1992). The reliability of this tool was verified by comparison with extant tools designed with the same goal in mind, such as gal_py, and is identical to that utilised by N20. Importantly, for this study, the SHyRT-framework calculates Galactic rotational velocity curves and includes them in the initial conditions for each simulated trajectory.
A.2. Initial conditions
The initial conditions for this simulation consist of seven primary parameters: the position in three dimensions, the ejection direction in three dimensions, and the total velocity with respect to the centre of mass of the progenitor system. All of these parameters were randomised as far as possible, using the prescription described below. For the velocity, we adopted the ejection velocity spectra presented by N20, (pseudo-)randomly1 choosing a discrete mass in the range of 0.2 M⊙ ≤ M ≤ 0.8 M⊙ (0.05 M⊙ intervals) for the donor (i.e. the runaway), then randomly choosing a velocity appropriate for that mass according to the spread of the spectrum (see also Appendix A.3). We made a conscious choice to only consider discrete values for runaway masses for convenience in population analysis. The chosen mass range corresponds to the ejection velocity spectra available from N20, the lower limit in that study being dictated by considerations of numerical stability and the upper limit by a desire to explore the production of HVS, with 0.8 M⊙ being close to the upper mass limit for production of HVS in the solar neighbourhood. For the ejection location, we assume that all stars originate from the Galactic plane, so no variation was assumed along the Galactic z-axis (though movement is fully allowed in 3D). For the remaining two dimensions, a polar coordinate system was adopted, and an angle in the range of 0 − 2 π was chosen randomly. The radius was also chosen randomly, though weighted such that the line number density of ejection locations obeys ρN(R)∝ρ(R)⋅R, where ρN(R) is the number density at distance from the Galactic centre R and ρ(R)2 is the number density at the same location (see Appendix A.4). The ejection direction was randomly chosen to conform to a flat isotropic distribution.
A.3. Ejection velocity spectra
Ejection velocities were chosen according to the ejection velocity spectra calculated by N20 (Fig. 8E) in the following way: a mass, assumed to be the runaway’s terminal mass before ejection, in the range of 0.2 M⊙ ≤ Mej ≤ 0.8 M⊙ was chosen randomly. Then, a value in the range of vej(Mej, min)−vej(Mej, max) was chosen, again randomly. The result of this process is illustrated in Fig. A.1, with exact values for the maximum and minimum ejection velocities for each discrete mass value given in Table A.1. The resulting velocity is assumed to be the space velocity of the runaway with respect to the centre of mass of the progenitor binary. Once the ejection location was determined (see Sect. 2 and Appendix A.4), the galactocentric ejection velocity was then calculated by taking the local Galactic rotational velocity as well as the, randomly determined, ejection direction into account.
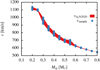 |
Fig. A.1. Ejection velocity spectra and sample runaway velocities as used in this study. The red shaded area (vej, N2020) denotes the range of ejection velocities as calculated by N20, and the blue dots (vsample) show the derived ejection velocities per system utilised in this study. See also Table A.1. |
Minimum vmin and maximum vmax ejection velocities for runaways of discrete terminal mass Mej as provided by N20 and utilised in this study (see also Fig. A.1).
A.4. The Galactic density distribution
As described in Sect. 2, the ejection locations for our model population were randomly chosen, but weighted according to the Galactic density distribution. The Galactic density distribution was assumed to be static and to correspond to Model 1 put forward by Irrgang et al. (2013) as a revision of Allen & Santillan (1991) in the form
 (A.2)
(A.2)
for the bulge and
 (A.3)
(A.3)
for the disc. See Table A.2 for utilised parameter values. We note that, while Irrgang et al. (2013) do provide a density distribution for the Galactic dark matter halo, the initial population in this study is assumed to be unaffected by the dark matter halo, only corresponding to the density distribution of baryonic matter.
The radial distribution of the ejection location was generated as follows: starting from the outer edge of the distribution (i.e. the edge of the Galactic disc), the radial coordinate was subdivided into a (not predetermined) number of bins. Starting at a relative bin width (Wcbin) of unity, every subsequent bin was assigned a width such that Wcbin ∝ 1/(ρ(R)⋅R). Radial coordinates were then assigned by randomly choosing one bin, then randomly choosing a value for R within that bin. We allowed radii up to 200 kpc.
The radial distribution of the ejection location is shown in Fig. A.2. We deem the randomised distribution to adequately conform to expectations. The distribution of ejection locations in the x − y-plane is shown in Fig. A.3. We note, in passing, that the most likely ejection location of the observed object US 708 lies close to the maximum in line density at ∼6 kpc.
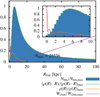 |
Fig. A.2. Normalised histogram of the radial distribution of ejection locations, overlaid with the normalised line density ρ(R)⋅R, normalised mass density (see Eqs. (A.2) and (A.3)). We note that Wcbin/Wcbin, max is the normalised width of the computational bins (see text). The inset is the same as the main plot, but restricted to the inner 10 kpc. |
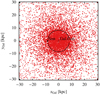 |
Fig. A.3. Illustration of randomised ejection locations used in this study in Galactocentric Cartesian coordinates. We note that, for legibility, only every 100th location is plotted. The black circle indicates the orbital radius of the Solar System around the Galactic centre. The positions of Earth (black dot) and the Galactic centre (black cross) are indicated. |
A.5. The Galactic potential
The functional form of the Galactic potential corresponds to the density distribution as described above (Model I, as proposed by Irrgang et al. 2013):
 (A.4)
(A.4)
for the bulge, where R is the distance from the Galactic centre,
 (A.5)
(A.5)
for the disc, where r is the distance from the Galactic centre in the x − y-plane and z is the distance from the x − y-plane and
![Mathematical equation: $$ \begin{aligned} \Phi _{\rm h}(R)&=-\frac{M_{\rm h}}{a_{\rm h}}\left[ \frac{1}{\gamma -1} \ln \left( \frac{1+(R/a_{\rm h})^{\gamma -1}}{1+(\Lambda /a_{\rm h})^{\gamma -1}} \right)\right.\nonumber \\&\quad \left.- \frac{(\Lambda /a_{\rm h})^{\gamma -1}}{(1 +\Lambda /a_{\rm h})^{\gamma -1}} \right]\,\mathrm{if}\,R < \Lambda \nonumber \\&= -\frac{M_{\rm h}}{R} \frac{(\Lambda /a_{\rm h})^{\gamma -1}}{(1 +\Lambda /a_{\rm h})^{\gamma -1}}\,\mathrm{if}\,R \ge \Lambda , \end{aligned} $$](/articles/aa/full_html/2021/02/aa40022-20/aa40022-20-eq13.gif) (A.6)
(A.6)
for the dark matter halo, with γ = 2, G = 1, and the other parameters given in Table A.2. The population is assumed to be non-self-gravitating. Therefore each simulated star is an isolated object moving in a static Galactic potential corresponding to the model presented above.
A.6. Runaway lifetimes and luminosities
The state of the former donor star at the point of ejection is, unfortunately, not accessible to our methodology. This leads to the necessity for adopting a number of compromises in the prediction of certain observationally useful parameters, as is explained later, and the remedies adopted, in this appendix. The state of the runaway at ejection is not accessible to us for a number of reasons. Firstly, the ejection velocity spectra adopted from N20 allowed for the conclusion that the terminal state and structure of the donor (as long as it is core-He burning) has less influence on the achievable runaway velocity than its mass. This is not true for the aftermath of the SN ejection, as the amount of available core He determines the length of the runaways remaining He MS lifetime. It is therefore to be expected that, unless prevented by some unrelated mechanism, two runaways, ejected by the same mechanism, may, despite having identical masses, have a significant difference in remaining He MS lifetimes. Secondly, the SN event itself may significantly alter the structural and observational properties of the runaway star. As most recently shown for this scenario by Bauer et al. (2019), the donor star is expected to lose a significant amount of material (more than 50% of its pre-explosion mass) and accumulate enough entropy from the shock interaction to expand to a structure not unlike that of a protostar. The ejected star may, after this, have lost enough mass to become incapable of further He fusion (generally, hydrogen depleted objects below about 0.3 M⊙ are incapable of He burning). If so, the ejected object will form first a proto-WD, then, after further contraction, a (extremely-) low mass WD. At the time of writing, insufficient data are available in the literature to cover the entirety of our parameter space and all eventualities. In order to confront these issues, we adopted the following assumptions and prescriptions: we neglected the difference in remaining He MS lifetimes of our runaways. Instead, we adopted certain remaining lifetimes according to terminal He donor mass, corresponding to the nuclear timescale of a typical He-star of the same mass. This implies that at ejection, each runaway has the entirety of its normal He burning lifetime ahead of it (except if M ≤ 0.3 M⊙, as discussed below). This leads to an underestimation of each star’s luminosity, as most stars of the type under consideration here are expected to brighten over time, but an overestimation of stars in their observable phase since, as mentioned above, most of the objects here will have a diminished remaining He burning lifetime at the point of ejection. The assumed lifetimes are given in Fig. A.5. Here, as stated, we assume a lifetime as given by the star’s nuclear lifetime if M > 0.3 M⊙ and thermal collapse on a timescale (corresponding to the values derived by Bauer et al. 2019) of 10 Myr if M < 0.3 M⊙.
In order to test our assumptions, we redid part of our analysis by artificially reducing the lifetimes of the ejected objects by half. We find that, beyond leading to a more pronounced peak at the same place in the distance distribution, which is a result of an expectedly more pronounced over-density in the vicinity of the initial distribution, this does not significantly alter our results (Fig. A.4).
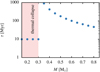 |
Fig. A.5. Assumed mass-dependent lifetimes of ejected stars in this study. Stars of M < 0.3 M⊙ are assumed to collapse and form (proto-) WDs without any further He burning. |
Appendix B: Effects of dynamical friction
Runaway sdO/B stars can form in dense stellar systems, such as globular clusters, mediated by dynamical interactions (as reported by Moehler et al. 1997). A detailed study of runaway sdO/B stars from these systems is beyond the scope of this Letter. However, we do remark that since the ejection velocity is mostly dictated by the donor’s mass prior to detonation, a runaway sdO/B star in, for example, a globular cluster is expected to have a similar ejection velocity compared to the field. Furthermore, given that the escape speed of globular clusters is up to ∼100 km s−1 (Gnedin et al. 2002) and the ejection speed lies roughly in the range between 550 and 1150 km s−1 (cf. Fig. A.1), we expect that the internal dynamics of the cluster have a negligible impact on the trajectory of the runaway star as it escapes the cluster.
More quantitatively, encounters with other stars in the cluster as the runaway star moves through it can be described to first approximation as a dynamical friction (DF) process3. The timescale TDF for DF to change the runaway’s speed v by order itself can be estimated as (Binney & Tremaine 2008, S8.1)
![Mathematical equation: $$ \begin{aligned} T_{\rm DF} \equiv &\left(\frac{1}{{ v}} \frac{\mathrm{d} { v}}{\mathrm{d} t} \right)^{-1} \sim \frac{{ v}^3}{4\pi G^2 M \rho \ln \Lambda } \left[ \mathrm{erf}(X) - \frac{2X}{\sqrt{\pi }} \exp \left(-X^2 \right) \right]^{-1}\nonumber \\ \approx &\frac{{ v}^3}{4\pi G^2 M \rho \ln \Lambda }\nonumber \\ \approx &1.3 \times 10^4 \,\mathrm{Gyr} \, \left( \frac{{ v}}{600\,\mathrm{km\,s}^{-1}} \right)^3 \left( \frac{M}{0.4\,M_\odot } \right)^{-1} \left( \frac{\rho }{10^4\,M_\odot \,\mathrm{pc}^{-3}} \right)^{-1}\nonumber \\&\times \left( \frac{\log \Lambda }{18} \right)^{-1}, \end{aligned} $$](/articles/aa/full_html/2021/02/aa40022-20/aa40022-20-eq14.gif) (B.1)
(B.1)
where  and σ is the velocity dispersion, ρ is the stellar density, and Λ is the Coulomb factor which we estimate as Λ ∼ bmax/b90 ∼ bmaxv2/[G(M + m⋆)] with bmax being the maximum impact parameter and m⋆ the typical stellar mass. Assuming M = 0.4 M⊙, m⋆ = 1 M⊙, v = 600 km s−1, and bmax = 1 pc, log Λ ∼ 18. The second line in Eq. (B.1) applies since X ∼ 42 ≫ 1 assuming σ = 10 km s−1 (e.g., Gnedin et al. 2002). The numerical estimate in Eq. (B.1) shows that TDF greatly exceeds the crossing or even the Hubble time for the smallest relevant ejection velocities, indicating that DF is unimportant. This is also borne out by a number of numerical direct N-body integrations that we carried out of N = 103 to 104 stars in a Plummer sphere with a Salpeter mass distribution, assigning an ejection velocity to one star in the centre. The resulting trajectory of the latter is virtually indistinguishable from the analytic expectation within the Plummer potential, and any deviation decreases with increasing N.
Appendix C: Observational considerations
The distinction between HVS and fast halo stars is, besides kinematics, as discussed above, made even more complicated by the fact that hot subdwarfs are affected by diffusion and mixing processes in their atmospheres (Schindewolf et al. 2018; Dorsch et al. 2020), which change their primordial abundances and make chemical tagging as a population tracer not feasible. The fraction of bound runaways and halo stars high above the Galactic plane is therefore hard to estimate.
Another selection bias is provided by the magnitude limit of the current surveys. To obtain RVs and in particular atmospheric parameters of a sufficient quality for a spectrophotometric distance determination (as provided by G15), current instrumentation only allows one to observe stars up to distances of about 10 kpc. Our simulations show, however, that most runaways are found much farther away from us.
The apparent lack of higher mass He-stars with 0.8 M⊙ might also be explained by selection effects. In contrast to main sequence stars, which have a well-defined empirical mass-radius relation, the masses of hot subdwarfs are not as easy to determine and the theoretically predicted core-mass for the He-flash in low-mass red giants is usually adopted as canonical mass. Most recently, accurate parallaxes from Gaia DR2 became available and can be used along with high-quality atmospheric parameters and photometry to constrain to the mass (Irrgang et al. 2019). For helium-enriched stars such as US 708, however, the systematic uncertainties on crucial parameters such as the surface gravity are still quite high and make a precise mass determination difficult. Given these problems, the population of intermediate-mass runaways that is still missing might just be hidden among the already discovered stars.
And finally, intermediate-mass helium stars can be quite luminous and can therefore be detected far away. Since they are predicted to be close to the disc, the substantial reddening caused by interstellar matter in the disc will then change their apparent colours significantly and move them out of the search spaces for our survey (Geier et al. 2019). Furthermore, such stars can be easily misclassified as main sequence stars as in the famous case of the proposed black hole binary LB-1 (Irrgang et al. 2019).
Appendix D: Supplementary results
In this appendix, we provide an extended heliocentric distance distribution, which was omitted from the main body of the paper for space.
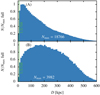 |
Fig. D.1. Extended range of the distribution in heliocentric distance (D). Upper panels: entire mass range (full sample) of runaway masses, lower panels: the same for the US 708-analogue sub-sample (reduced sample). The heliocentric distance of US 708 is as indicated. |
All Tables
Minimum vmin and maximum vmax ejection velocities for runaways of discrete terminal mass Mej as provided by N20 and utilised in this study (see also Fig. A.1).
All Figures
|
Fig. 1. Normalised number density distributions of the synthetic population in Galactic Cartesian coordinates as labelled. Upper panels: entire mass range (full sample) of runaway masses, lower panels: the same for the US 708-analogue sub-sample (reduced sample). The relative position of Earth along each axis is as indicated. We note that the distribution extends beyond the plotted range in all subplots, and the depicted range was chosen for clarity. |
| In the text | |
|
Fig. 2. Observational characteristics of our synthetic population in right ascension (RA), declination (Dec), and heliocentric distance (D). Upper panels: entire mass range (full sample) of runaway masses, lower panels: the same for the US 708-analogue sub-sample (reduced sample). The full distribution, the D-distribution (panel C1), is shown in orange in panel C2 for comparison. Relative positions of the Galactic centre (GC) and US 708 are given for reference. We note that in RA and Dec the sample is restricted to objects closer than 20 kpc. See Appendix D for an extended plot of the distance distribution (C1 and C2). |
| In the text | |
|
Fig. 3. Parameters of motion of our synthetic population, truncated at a distance of D = 20 kpc with proper motions in RA (μRA) and Dec (μDec) as labelled. Further, RV is the radial velocity (i.e. velocity along the line of sight). |
| In the text | |
|
Fig. A.1. Ejection velocity spectra and sample runaway velocities as used in this study. The red shaded area (vej, N2020) denotes the range of ejection velocities as calculated by N20, and the blue dots (vsample) show the derived ejection velocities per system utilised in this study. See also Table A.1. |
| In the text | |
|
Fig. A.2. Normalised histogram of the radial distribution of ejection locations, overlaid with the normalised line density ρ(R)⋅R, normalised mass density (see Eqs. (A.2) and (A.3)). We note that Wcbin/Wcbin, max is the normalised width of the computational bins (see text). The inset is the same as the main plot, but restricted to the inner 10 kpc. |
| In the text | |
|
Fig. A.3. Illustration of randomised ejection locations used in this study in Galactocentric Cartesian coordinates. We note that, for legibility, only every 100th location is plotted. The black circle indicates the orbital radius of the Solar System around the Galactic centre. The positions of Earth (black dot) and the Galactic centre (black cross) are indicated. |
| In the text | |
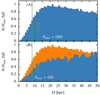 |
Fig. A.4. Same as Fig. 2C, but with artificially reduced lifetimes, i.e. τ → τ/2. |
| In the text | |
|
Fig. A.5. Assumed mass-dependent lifetimes of ejected stars in this study. Stars of M < 0.3 M⊙ are assumed to collapse and form (proto-) WDs without any further He burning. |
| In the text | |
|
Fig. D.1. Extended range of the distribution in heliocentric distance (D). Upper panels: entire mass range (full sample) of runaway masses, lower panels: the same for the US 708-analogue sub-sample (reduced sample). The heliocentric distance of US 708 is as indicated. |
| In the text | |
Current usage metrics show cumulative count of Article Views (full-text article views including HTML views, PDF and ePub downloads, according to the available data) and Abstracts Views on Vision4Press platform.
Data correspond to usage on the plateform after 2015. The current usage metrics is available 48-96 hours after online publication and is updated daily on week days.
Initial download of the metrics may take a while.