Fig. 1.
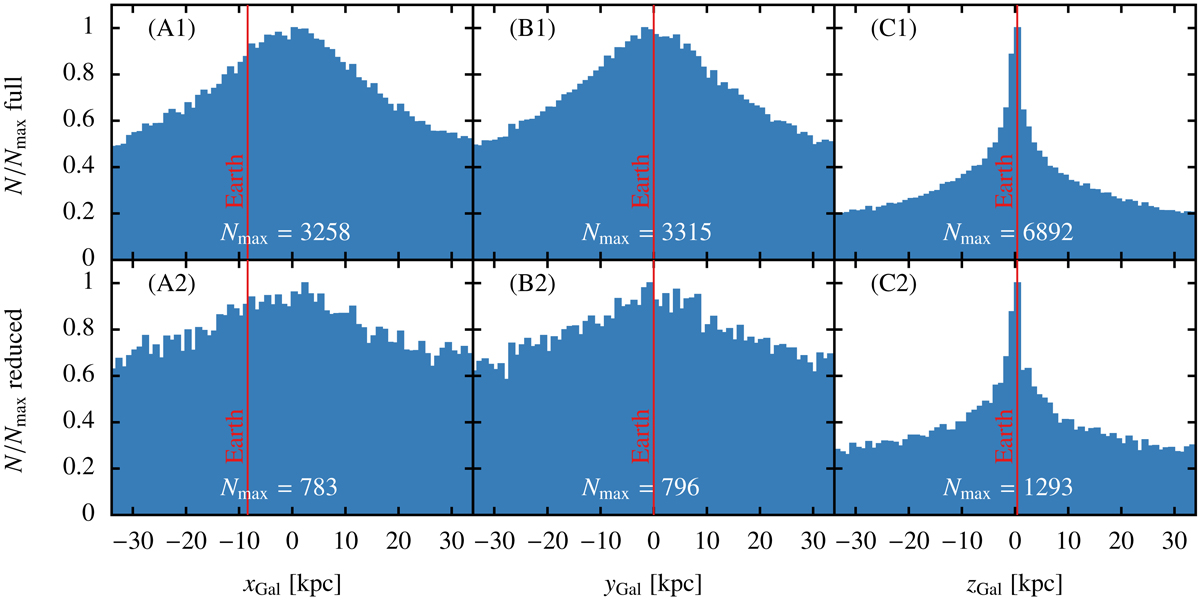
Normalised number density distributions of the synthetic population in Galactic Cartesian coordinates as labelled. Upper panels: entire mass range (full sample) of runaway masses, lower panels: the same for the US 708-analogue sub-sample (reduced sample). The relative position of Earth along each axis is as indicated. We note that the distribution extends beyond the plotted range in all subplots, and the depicted range was chosen for clarity.
Current usage metrics show cumulative count of Article Views (full-text article views including HTML views, PDF and ePub downloads, according to the available data) and Abstracts Views on Vision4Press platform.
Data correspond to usage on the plateform after 2015. The current usage metrics is available 48-96 hours after online publication and is updated daily on week days.
Initial download of the metrics may take a while.