Fig. A.2.
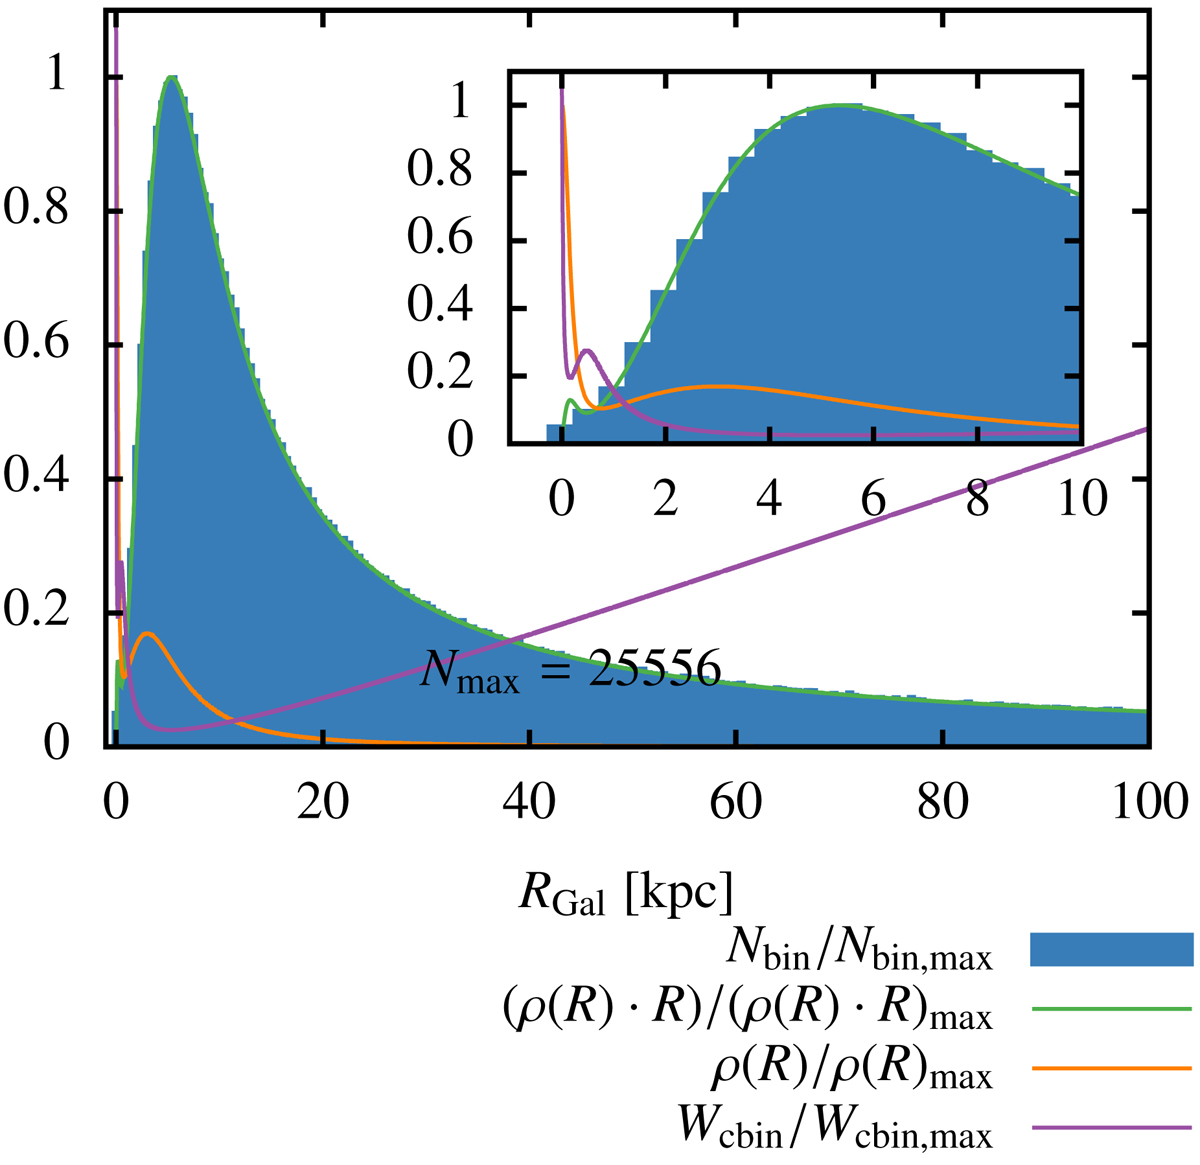
Normalised histogram of the radial distribution of ejection locations, overlaid with the normalised line density ρ(R)⋅R, normalised mass density (see Eqs. (A.2) and (A.3)). We note that Wcbin/Wcbin, max is the normalised width of the computational bins (see text). The inset is the same as the main plot, but restricted to the inner 10 kpc.
Current usage metrics show cumulative count of Article Views (full-text article views including HTML views, PDF and ePub downloads, according to the available data) and Abstracts Views on Vision4Press platform.
Data correspond to usage on the plateform after 2015. The current usage metrics is available 48-96 hours after online publication and is updated daily on week days.
Initial download of the metrics may take a while.