Fig. 7.
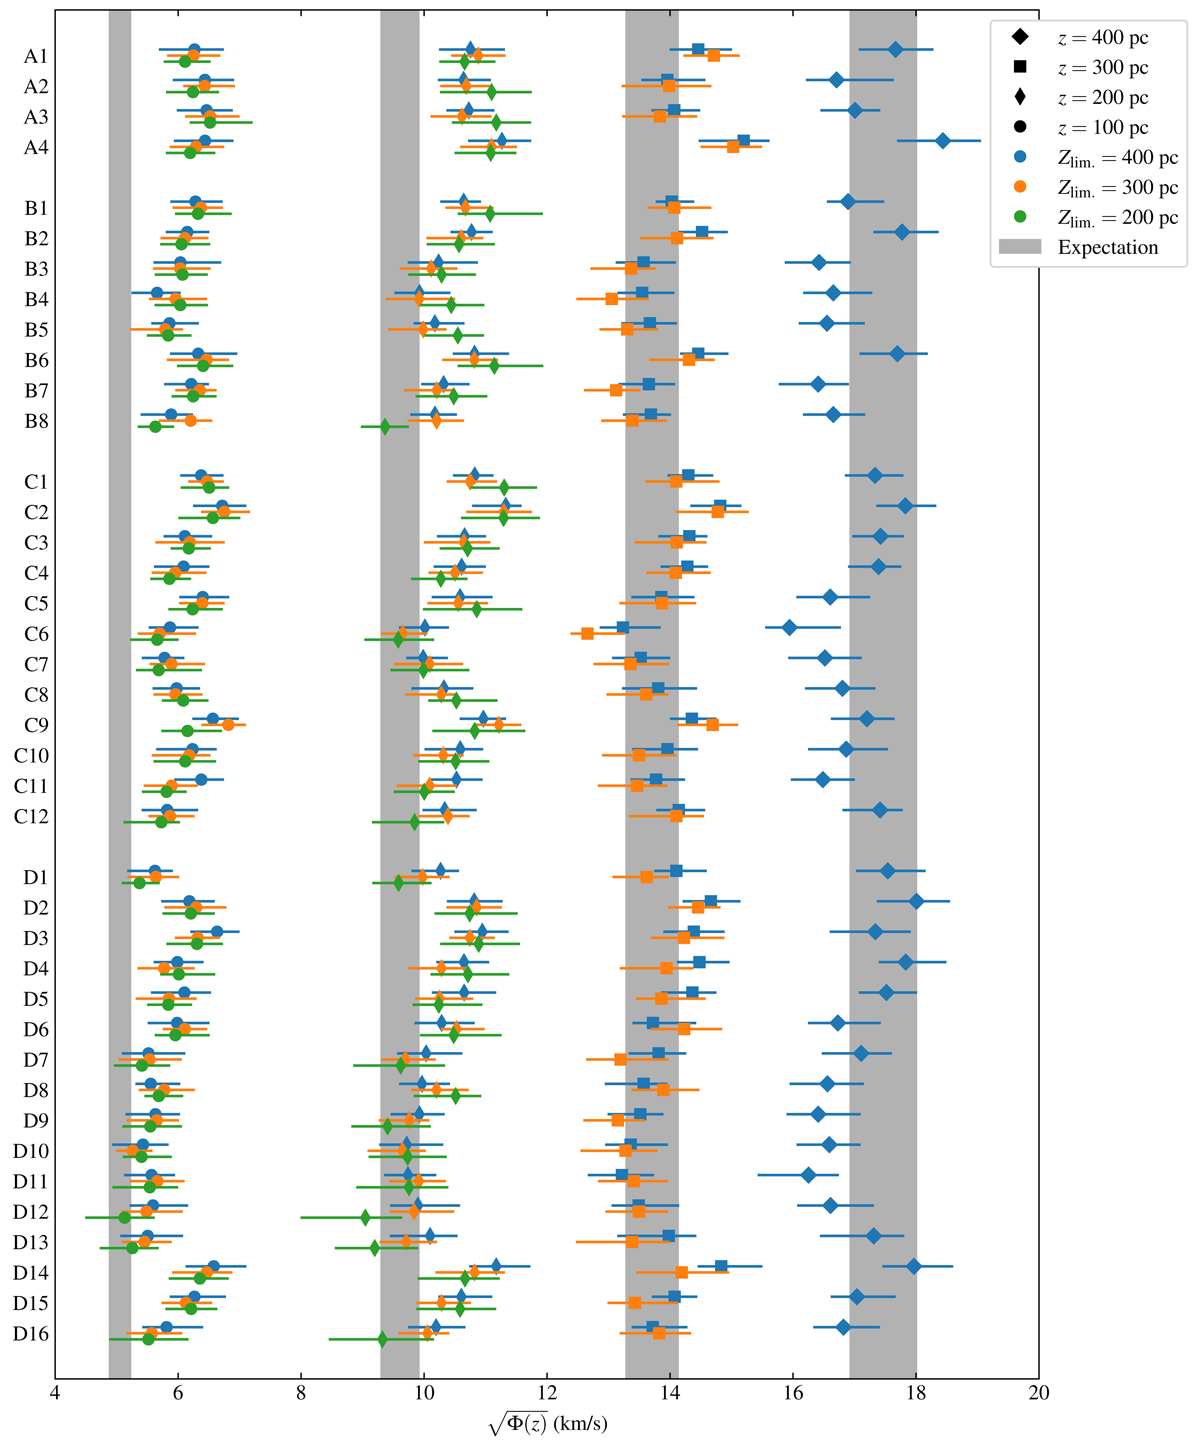
Inferred potential for the 120 stellar samples, presented in terms of ![]() , where z = {100, 200, 300, 400} pc. The samples are listed vertically in terms of area cells, and in subgroups of descending Zlim. (also labelled by colour according to the legend). Each respective marker shows the median gravitational potential of the inferred posterior distribution, and the marker’s shape represents the height z according to the legend. The horizontal lines represent the posterior widths, whose endpoints are equal to the 16th and 84th percentile of the posterior distribution. The 1σ bands of the expected gravitational potential at the respective heights are shown in grey.
, where z = {100, 200, 300, 400} pc. The samples are listed vertically in terms of area cells, and in subgroups of descending Zlim. (also labelled by colour according to the legend). Each respective marker shows the median gravitational potential of the inferred posterior distribution, and the marker’s shape represents the height z according to the legend. The horizontal lines represent the posterior widths, whose endpoints are equal to the 16th and 84th percentile of the posterior distribution. The 1σ bands of the expected gravitational potential at the respective heights are shown in grey.
Current usage metrics show cumulative count of Article Views (full-text article views including HTML views, PDF and ePub downloads, according to the available data) and Abstracts Views on Vision4Press platform.
Data correspond to usage on the plateform after 2015. The current usage metrics is available 48-96 hours after online publication and is updated daily on week days.
Initial download of the metrics may take a while.