Free Access
Fig. 6.
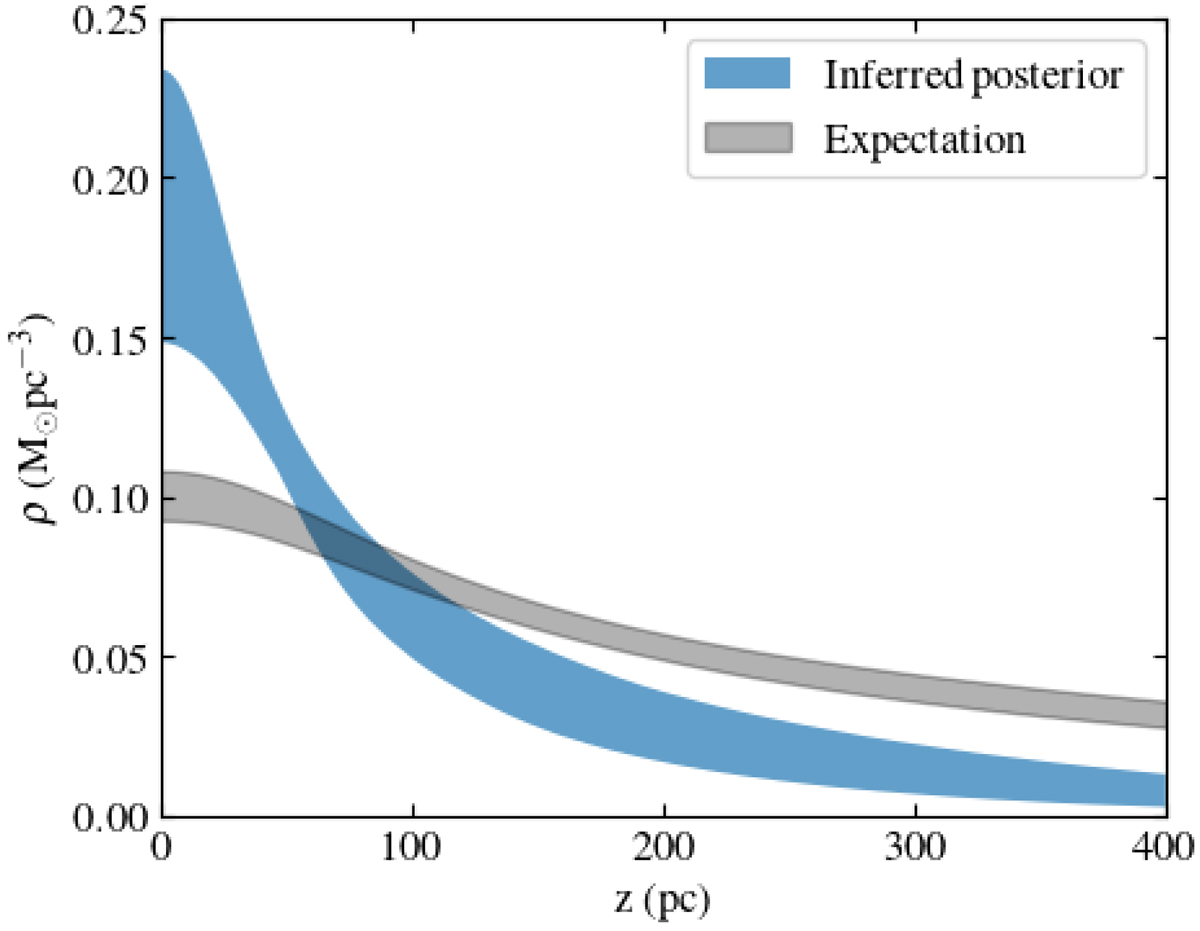
Inferred total matter density profile of stellar sample A1-400. The width of the blue band shows the 16th to 84th percentile of the inferred posterior density. The 1σ band of the expected gravitational potential is shown in grey.
Current usage metrics show cumulative count of Article Views (full-text article views including HTML views, PDF and ePub downloads, according to the available data) and Abstracts Views on Vision4Press platform.
Data correspond to usage on the plateform after 2015. The current usage metrics is available 48-96 hours after online publication and is updated daily on week days.
Initial download of the metrics may take a while.