Fig. 5.
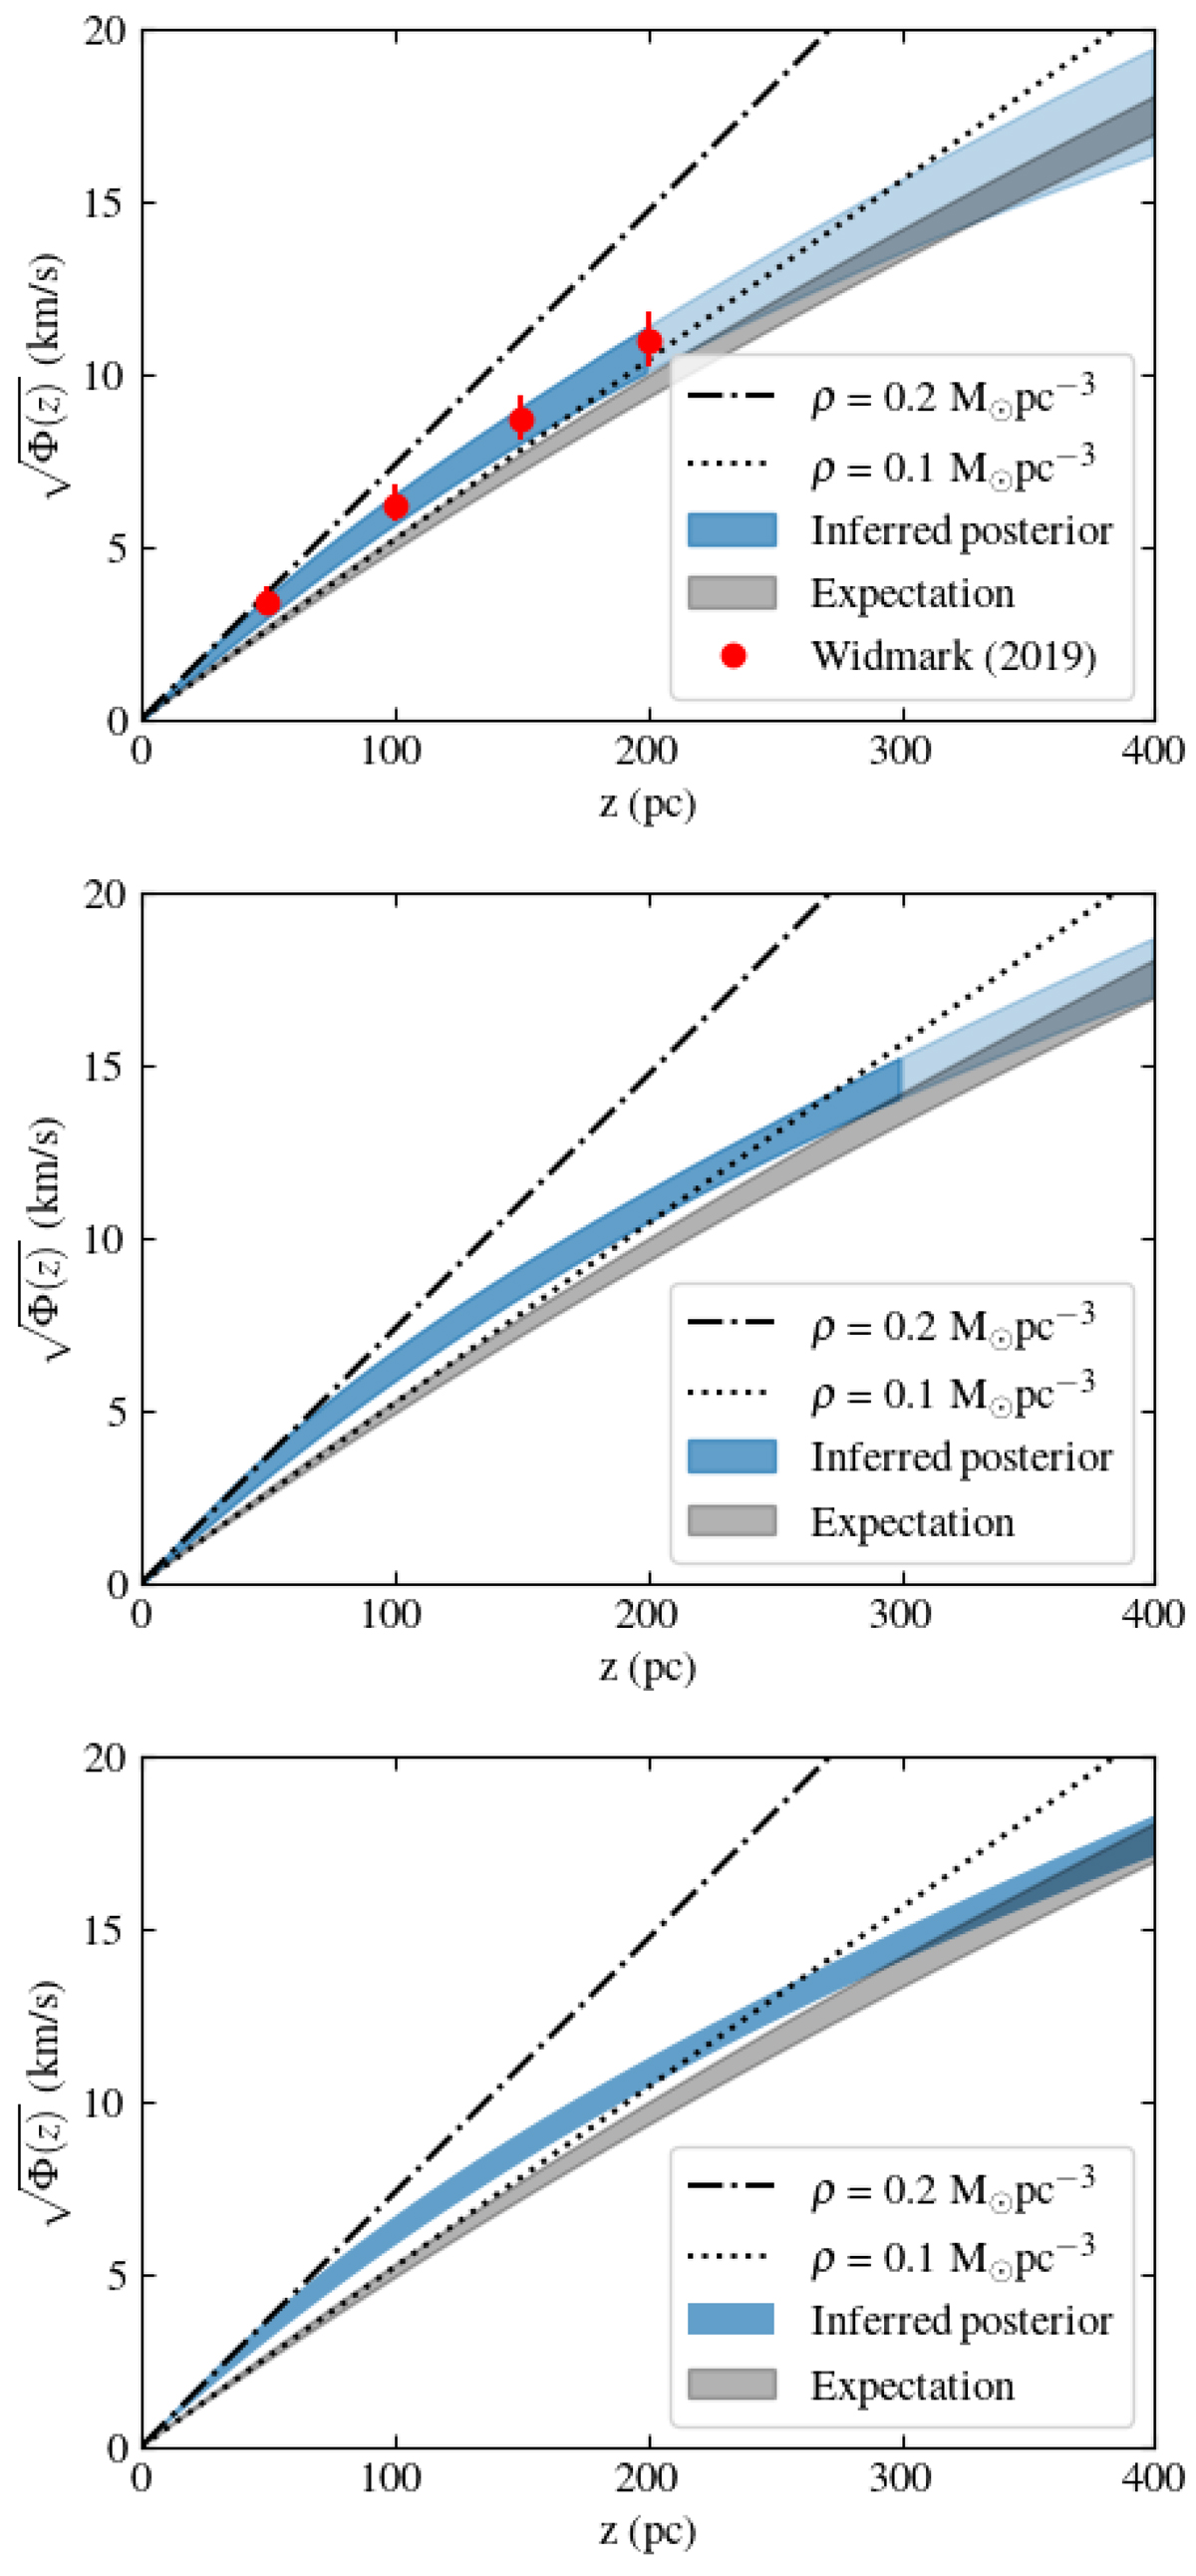
Inferred gravitational potential of stellar samples A1-200, A1-300, and A1-400, in the top, middle, and bottom panel, plotted in terms of its square root as a function of z. The width of the blue band shows the 16th to 84th percentile of the inferred posterior density of the respective stellar samples. The band has a lighter colour for z > Zlim., indicating that this is an extrapolation outside the spatial volume of the stellar sample. The 1σ band of the expected gravitational potential is shown in grey (identical in all panels). The black dash-dotted and dotted lines show the gravitational potential in case of a homogeneous matter density of 0.2 and 0.1 M⊙ pc−3. Top panel: we also plot the inferred potential of Widmark (2019) in red, where the dot indicates the median and the error bars cover the 10th and 90th percentiles of that work’s eight stellar sample posterior densities.
Current usage metrics show cumulative count of Article Views (full-text article views including HTML views, PDF and ePub downloads, according to the available data) and Abstracts Views on Vision4Press platform.
Data correspond to usage on the plateform after 2015. The current usage metrics is available 48-96 hours after online publication and is updated daily on week days.
Initial download of the metrics may take a while.