Fig. D.1.
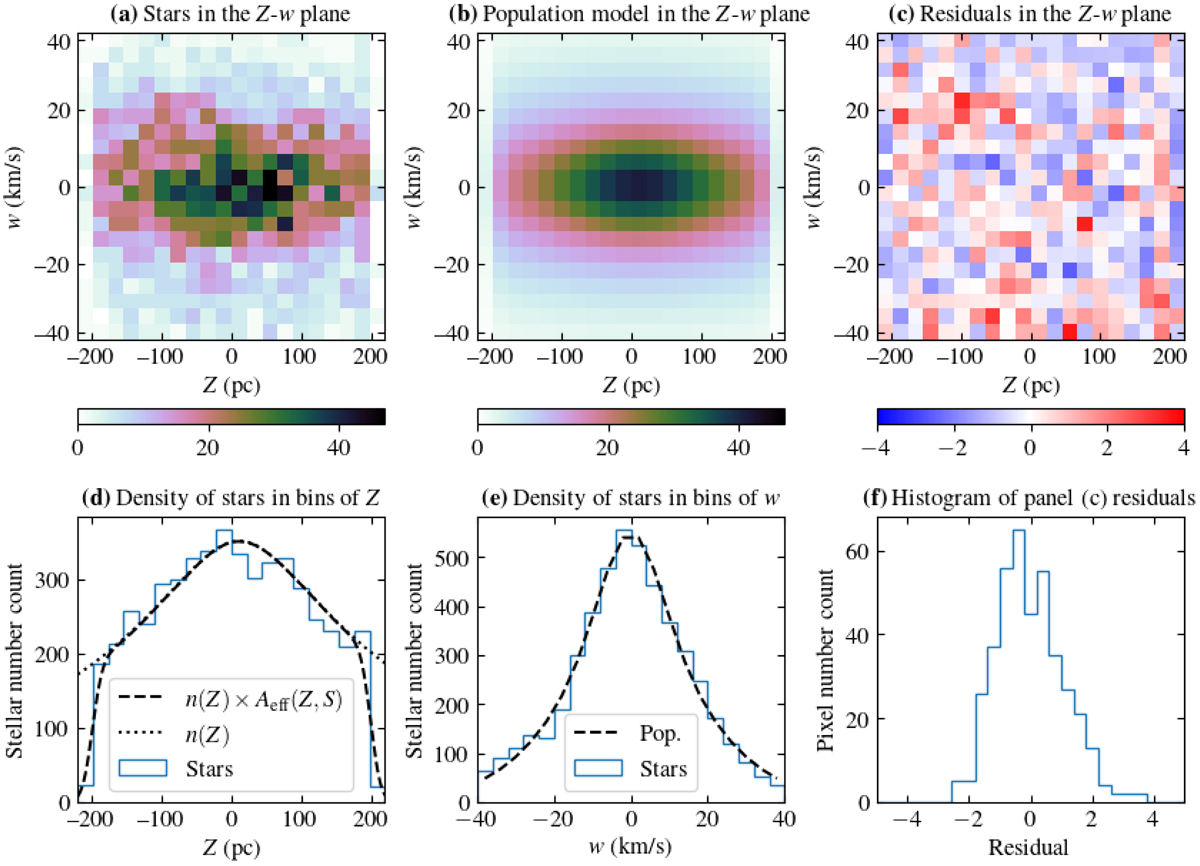
Control plot for sample A1-200, showing the distribution of vertical position Z and vertical velocity w in one-dimensional and two-dimensional histograms, for a randomly drawn realisation of the posterior probability density. The colour bars of panels a and b show the number of stars in each respective pixel in the Z–w plane, and use the same normalisation. The colour bar in panel c shows the residuals of each respective pixel, which is the tension between the phase-space number count according to the population model and the stellar parameters (which is strongly constrained by the data). Panel d: the dashed and dotted black lines correspond to the stellar number density according to the population model, where the former includes the effective area. Similarly, the dashed black line in panel e shows the distribution of vertical velocities (marginalised over Z) according to the population model.
Current usage metrics show cumulative count of Article Views (full-text article views including HTML views, PDF and ePub downloads, according to the available data) and Abstracts Views on Vision4Press platform.
Data correspond to usage on the plateform after 2015. The current usage metrics is available 48-96 hours after online publication and is updated daily on week days.
Initial download of the metrics may take a while.