Fig. 10.
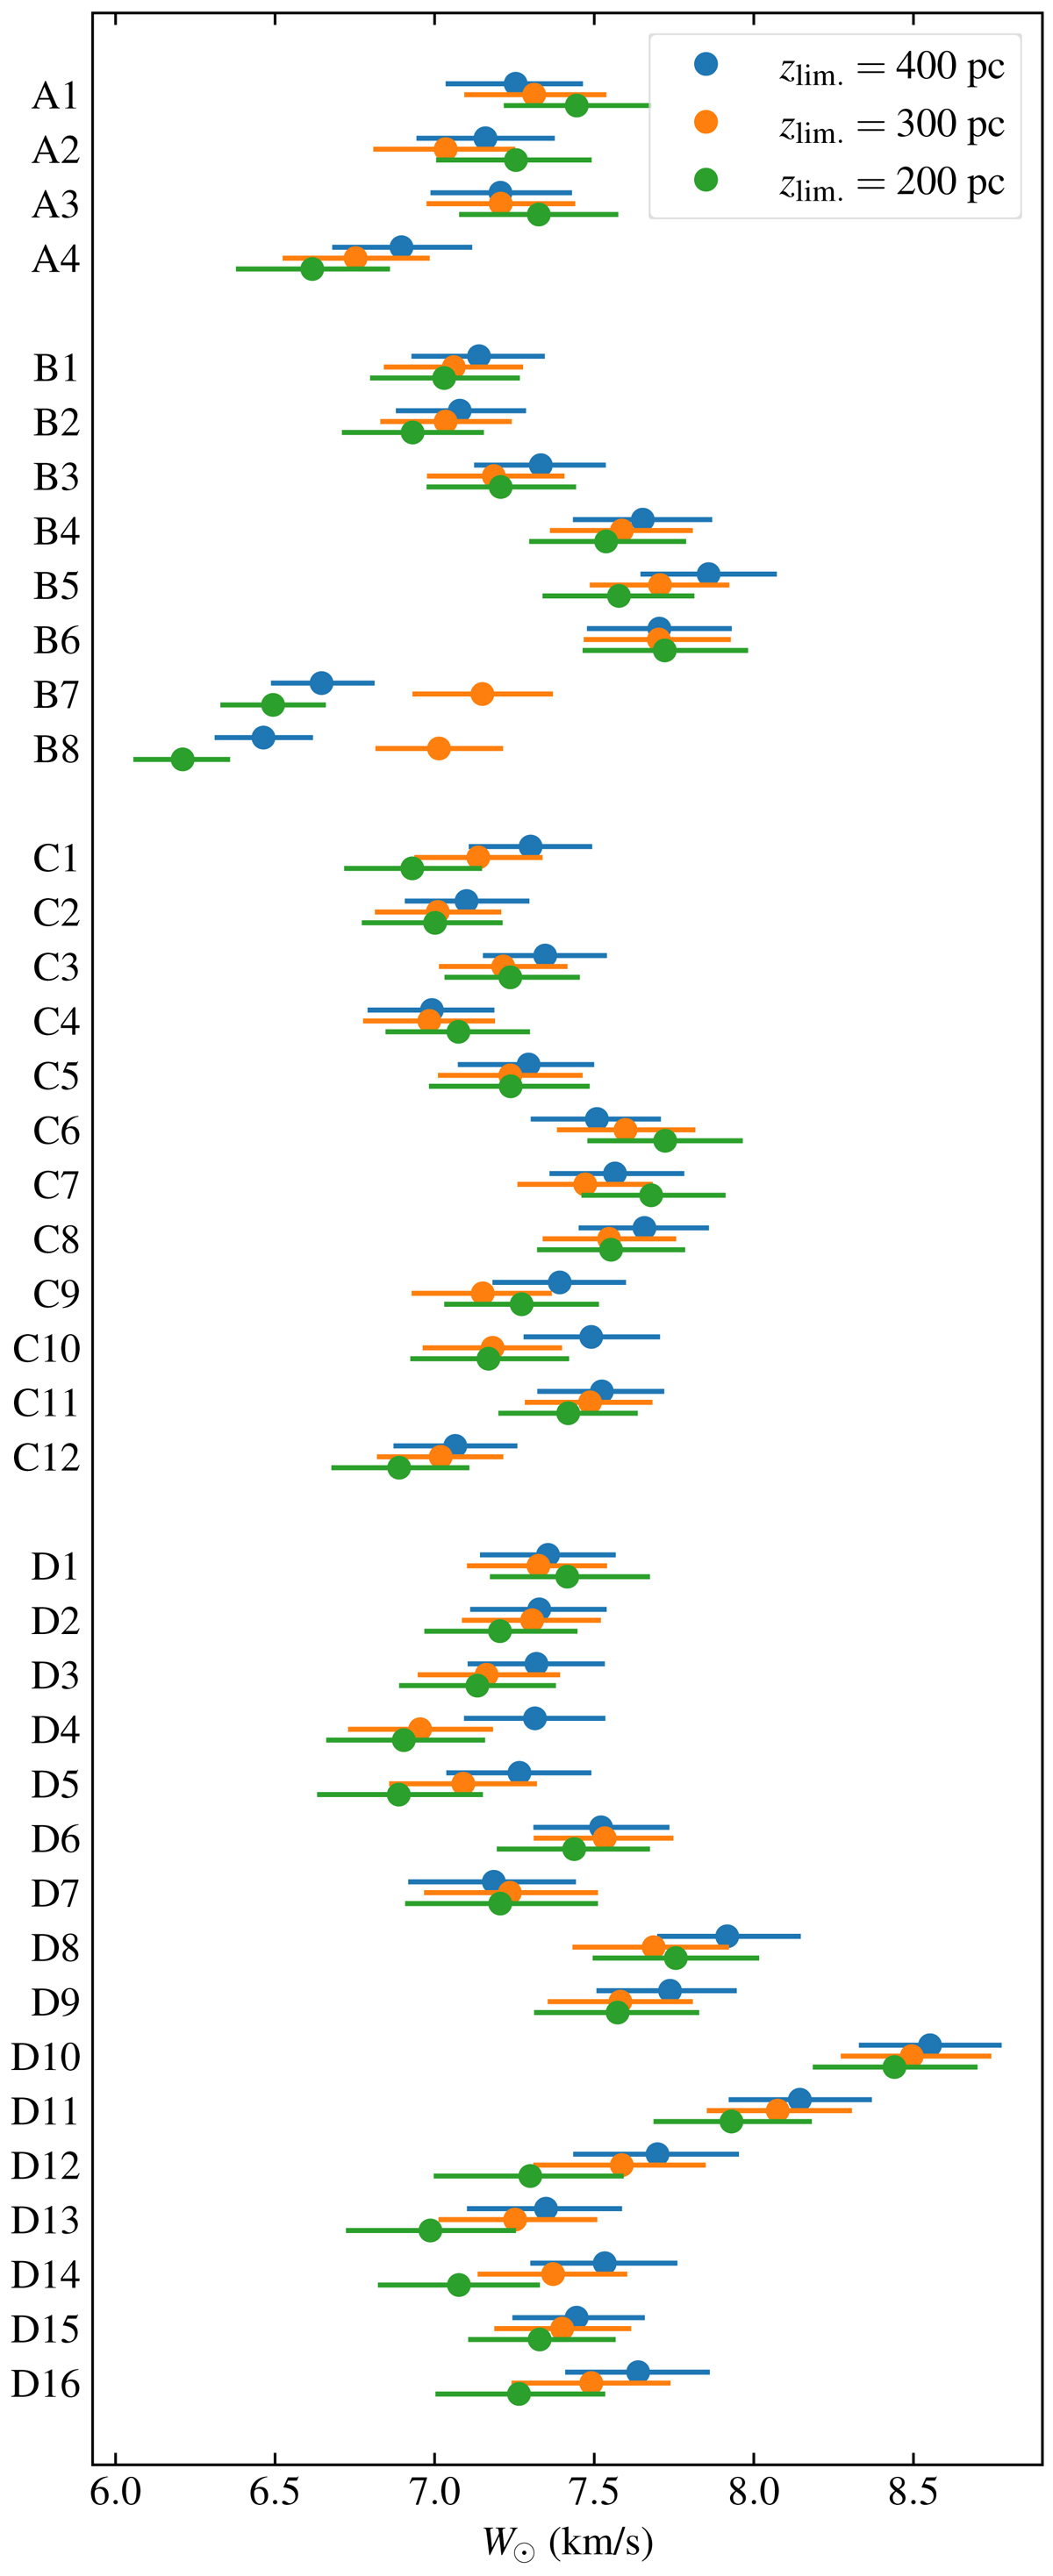
Inferred vertical velocity of the Sun, W⊙, for the 120 stellar samples. The samples are listed vertically according to area cell, in groups of three for different Zlim. in descending order, which are labelled by colour according to the legend. The horizontal lines represent the posterior widths, whose endpoints are equal to the 16th and 84th percentile of the posterior distribution.
Current usage metrics show cumulative count of Article Views (full-text article views including HTML views, PDF and ePub downloads, according to the available data) and Abstracts Views on Vision4Press platform.
Data correspond to usage on the plateform after 2015. The current usage metrics is available 48-96 hours after online publication and is updated daily on week days.
Initial download of the metrics may take a while.