Fig. 7.
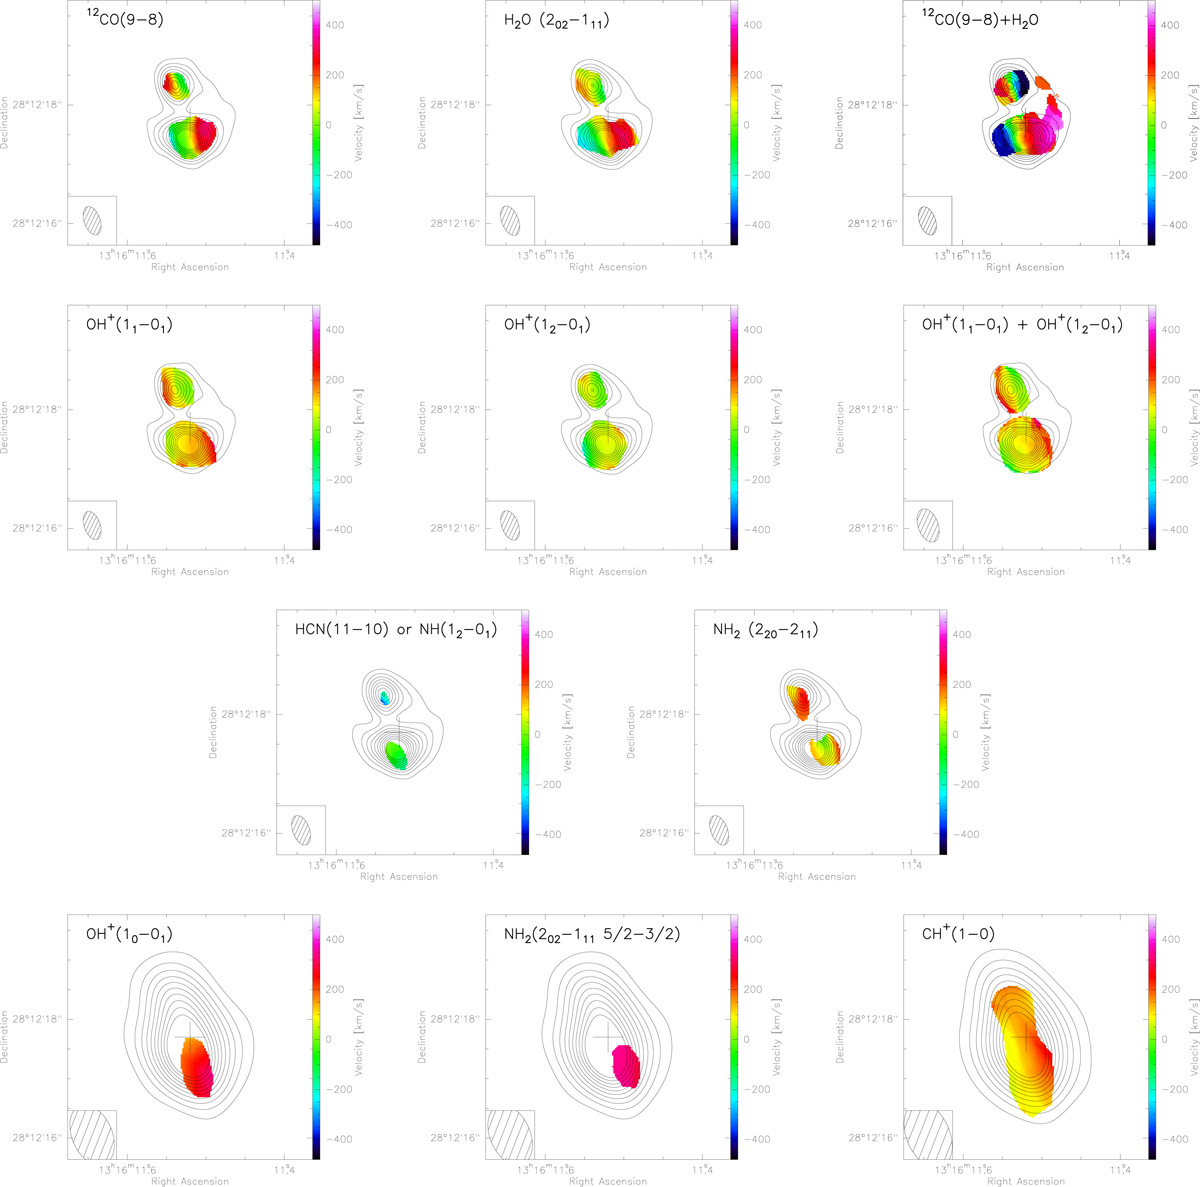
Velocity field maps (shown in colors) in each of the molecular emission and absorption lines detected in HerBS-89a superimposed on the continuum at the individual frequencies of each molecular line (in contours of 10σ spacing). The velocity maps were obtained above 3σ thresholds in the zero-th moment map of the molecular lines. As in Fig. 4, the three top rows display the high-angular resolution data, whereas the lower row shows the lower-angular resolution images. Upper right panel: combined 12CO(9 − 8) and H2O(202 − 111) image that reveals the kinematics along the western arm of the partial Einstein ring. Right panel in the second row: combined velocity field of the two OH+ absorption lines ((11 − 01) and (12 − 01)). The synthesized beam is shown in the lower left corner of each of the images.
Current usage metrics show cumulative count of Article Views (full-text article views including HTML views, PDF and ePub downloads, according to the available data) and Abstracts Views on Vision4Press platform.
Data correspond to usage on the plateform after 2015. The current usage metrics is available 48-96 hours after online publication and is updated daily on week days.
Initial download of the metrics may take a while.