Fig. 5.
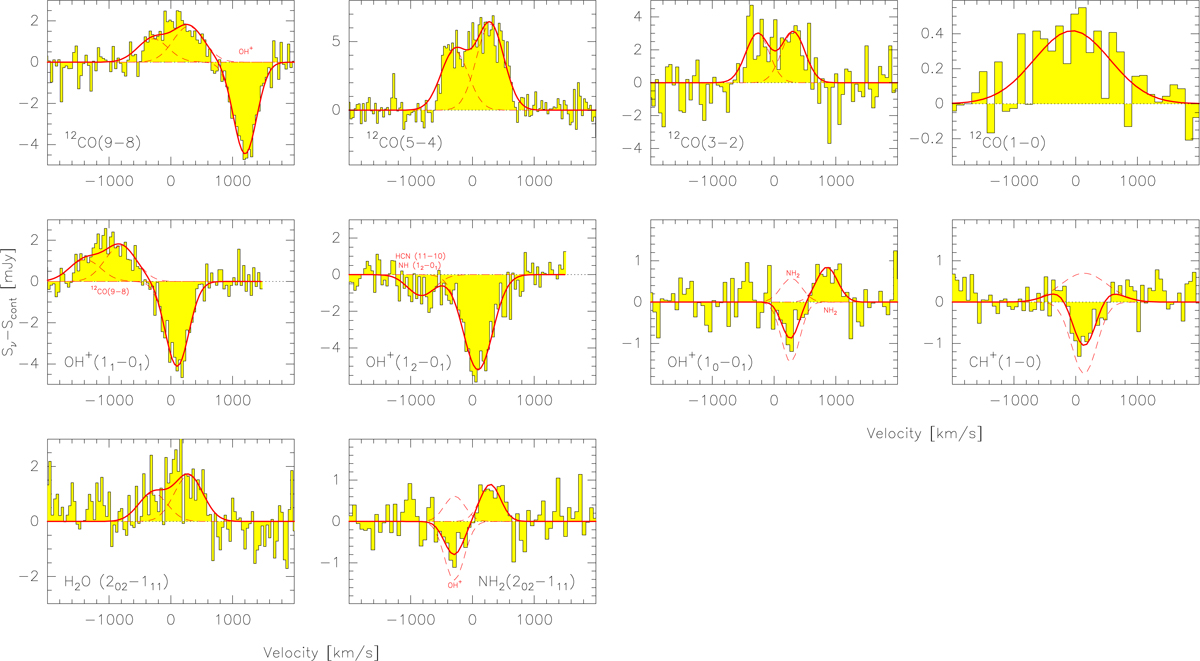
Spectra of the molecular emission and absorption lines detected in HerBS-89a reported in this study, together with the 12CO(5 − 4) and 12CO(3 − 2) spectra from Neri et al. (2020). Each molecular line is identified in the lower corner of each panel (labeled in black) and, in the case of a line overlap, as 12CO(9 − 8)/OH+(11 − 01), OH+(12 − 01)/HCN(11 − 10) and OH+(10 − 01)/o − NH2(202 − 111)(5/2 − 3/2), the second molecular line is labeled in red. The spectra are displayed with the continuum subtracted and, in each panel, the molecular line (labeled in black) is plotted relative to the zero velocity corresponding to its rest frequency. Fits to the emission and absorption molecular lines are shown as solid lines, and, when multi-component and/or multiple lines have been fitted, they are displayed individually as dashed lines (see text for details).
Current usage metrics show cumulative count of Article Views (full-text article views including HTML views, PDF and ePub downloads, according to the available data) and Abstracts Views on Vision4Press platform.
Data correspond to usage on the plateform after 2015. The current usage metrics is available 48-96 hours after online publication and is updated daily on week days.
Initial download of the metrics may take a while.